Some traders have developed technical analysis trading systems based on astrology with a particular focus on technical indicators that highlight the moon phases and important dates.
In financial astrology, the moon phases represent humans emotions and psychology and some traders believe that the moon phases can affect the trading emotions of traders which can cause price reversals during these changing moon phases.
To use astrology in technical analysis:
- Apply specific astrology based technical indicators to the price charts of financial markets
- Watch for price reversals at important moon phases or dates
- Backtest the astrology technical indicators to ensure it works in a particular market
In many astrology based technical analysis trading strategies, traders use the moon phases in conjunction with other technical analysis studies like chart patterns or support and resistance levels.
Simply browsing through various price charts of markets and assessing the effectiveness of astrology based indicators is helpful for new traders to quickly learn technical analysis astrology and to determine for themselves whether it's a useful method of market analysis.
1. Apply Specific Astrology Based Technical Analysis Indicators To Price Charts
To use astrology in technical analysis, traders can use astrology based technical trading indicators and overlay them onto the price charts of financial markets like futures, commodities, stocks and bond markets.
Examples of astrology based technical analysis indicators to use include:
- Moon Phases Indicator
- InSillico's Four Seasons Indicator
- Financial Astrology Mercury Longitude Indicator
These indicators typically plot the moon phases and other important dates in astrology onto the price charts so traders can easily determine if there is a correlation in the price action or not.
A charting platform and technical analysis tool provider like TradingView provides free charting and astrology based indicators.
These indicators can be found on the TradingView website in the indicators tab.
Below are examples of these astrology based technical indicators in action.
Moon Phases Astrology Indicator Price Chart Example

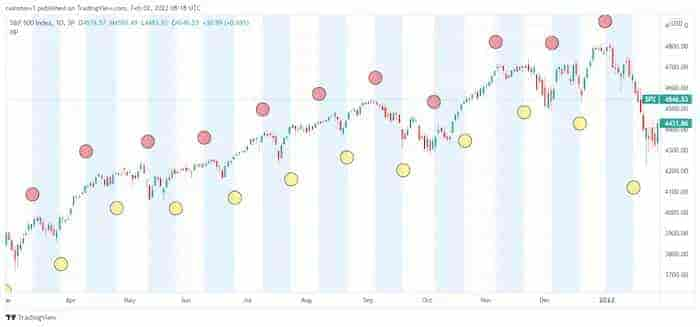
The Moon Phases indicator plots the Full Moon, New Moon, Waning Moon and Growing Moon on the price charts of markets.
In the above price chart image example of the moon phase indicator:
- The red circle marks the new moon date
- The yellow circle marks the full moon date
- The shaded blue area marks the growing moon phase
- The white area marks the waning moon phase
New traders can browse through various capital markets to see whether the moon phases indicator is a useful tool to help analyze markets.
Four Seasons Astrology Indicator Chart Example

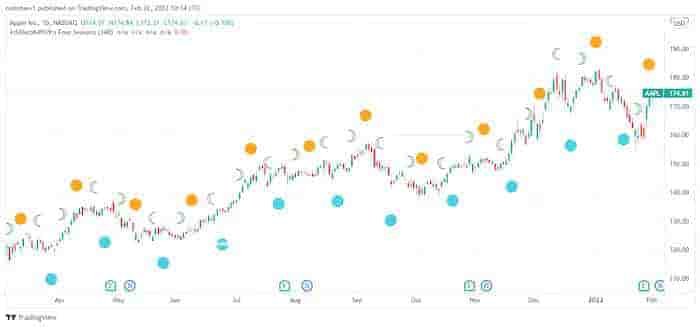
The Four Seasons Indicator is an astrology based technical analysis indicator that plots and shows the new and full moons, the waning moons, the four season of Winter, Summer, Fall and Spring, the Eqinoxes and Stolstices dates.
In the above price chart example image of the four seasons indicator:
- The yellow circle indicates a new moon date
- The blue circle indicates a new full moon date
- The symbol "☽" represents a waning moon
- The symbol "☾" represents the first moon
New traders can use this technical analysis indicator to plot important moments in astrology on price charts.
Financial Astrology Mercury Longitude Indicator Chart Example

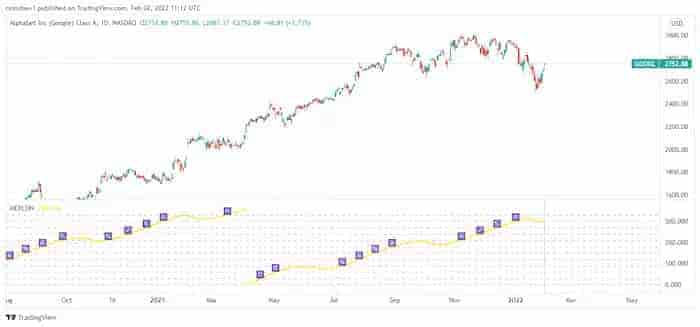
As per Citlacom (the creator), the Financial Astrology Mercury Longitude Indicator is based on an ephemeris array that covers years 2010 to 2030, prior or after these years the longitude is not available (1).
This indicator plots important astrology phases and dates on a chart for traders to easily view and test how prices reacted on these dates and time periods.
2. Watch For Price Reversals At Important Astrology Dates/Phases
Use the indicators to see how price reacts at various astrology dates or moon phases. There are thousands of markets and these astrology-based indicators may be better in some markets over others.
Checking different financial markets to see how a moon phase might affect the price of the market may give a new trader a trading edge, but this will depend on how much research a trader does.
Using these indicators in conjunction with other technical analysis patterns or indicators may also prove to be useful.
3. Backtest The Astrology Technical Indicators To Ensure It Works
Before applying an astrology-based technical indicator to a live trading account with real capital, a new trader or investor should backtest the various financial astrology indicators to see how effective they are as a trading or investing strategy.
Using the technical indicator in TradingView labeled "Moon Phases Strategy [LUX]", a trader can backtest and get historical results of using this indicator for generating buying and shorting signals.
It is also worth trading with these indicators on a paper or demo trading account to practice using astrology-based indicators risk-free.
Does Using Astrology In Technical Analysis Actually Work?
There is very little evidence on the effectiveness of using an astrology-based technical analysis approach to trading or investing.
One research study published in the International Journal Of Economic And Business Research found that astrology factors that have the greatest chance of reversal of JCI include moon phase (17%), planet aspect (14%), moon declination (12%), retrograde (7%), and planet ingress (6%) and astrology factors that have the greatest chance of reversing the Gold price included the moon phase (19%), moon declination (19%), planet aspect (17%), retrograde (16%), and planet ingress (6%).
This study concluded that financial astrology had a low effectiveness level in determining price reversals in these 2 markets with the highest level of prediction at only 19% (2).
