There are thousands of technical indicators available for traders to practice using in their trading.
A good technical indicator can help a trader or technical analyst with reading price charts of any markets from stocks, forex, commodities and cryptocurrencies.
Picking the right trading indicators can be difficult with so many options to choose from.
Many traders use the technical indicators listed in combination with each other for higher probability buy and sell signals.
The 6 best technical indicators for traders are:
- Relative Strength Index (RSI)
- Volume
- MACD
- Fibonacci Retracement
- On Balance Volume (OBV)
- Average True Range (ATR)
These technical indicators are both overlay or oscillator indicators. Overlay indicators are indicators that overlay on a price chart while oscillators are generally placed above or below the price chart.
1. Relative Strength Index (RSI)
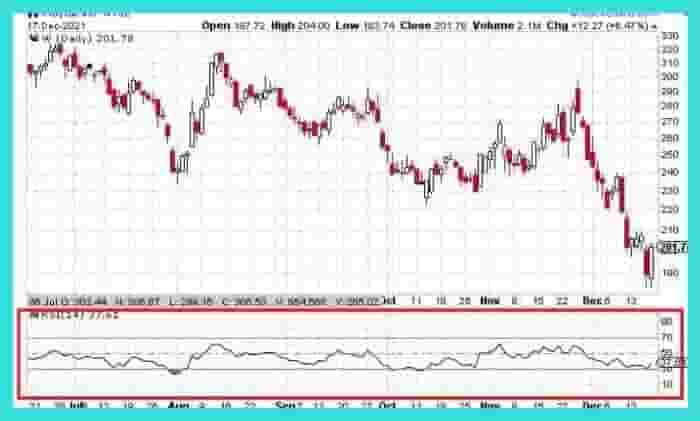
The relative strength index is a top indicator for gauging the momentum and strength of a price trend in any market.
The RSI indicator can be used for spotting markets that are overbought and oversold.
A market is overbought when the RSI indicator is producing a reading of over 70 and oversold when the RSI is below 30.
The RSI indicator can also be used for spotting potential support and resistance levels when used in combination with other technical analysis tools like chart patterns.
2. Volume
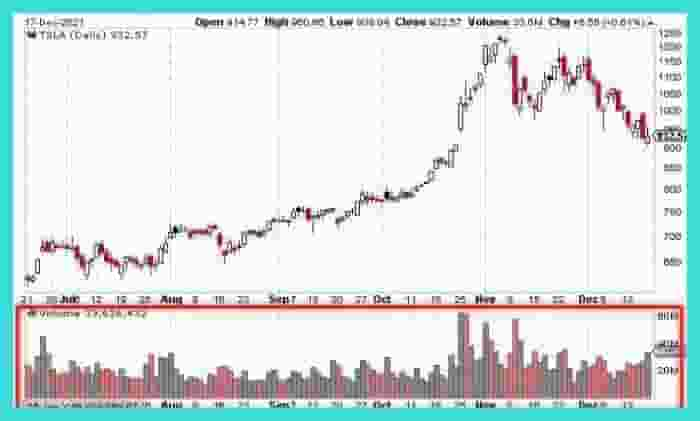
The volume traded in any market is one of the most popular indicators used by a trader.
The volume indicator shows how much volume is traded at any given time in the market.
Typically, the indicator is placed below the price and can signal when large institutions are entering or exiting a market.
Volume is used as part of most technical analysis strategies to add a confirmation to a buy or sell signal, in particular breakout strategies used by chart pattern traders.
When volume is rising in the color green, it indicates that traders are buying large blocks of a stock, commodity, index, etc.
When volume is rising in the red color, it indicates that traders are selling in large volumes.
3. Moving Average Convergence Divergence (MACD)
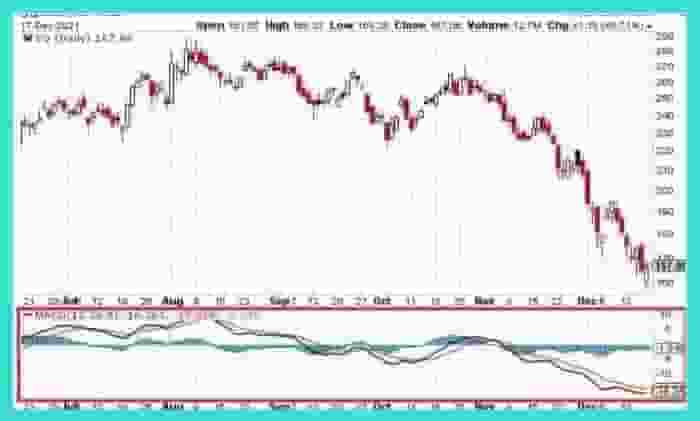
The MACD indicator is another common technical analysis indicator used by traders.
The MACD helps traders to find trend reversals in any market. When the MACD is above zero, the price is in an uptrend and when it’s below zero, the price is in a downtrend.
Traders focus on when the MACD reaches the extreme levels of its boundaries or if the MACD lines cross over.
A MACD crossover can signal a potential change in price. A MACD is also used as a trading signal when the MACD crosses the zero level (or midpoint line)
4. Fibonacci Retracement
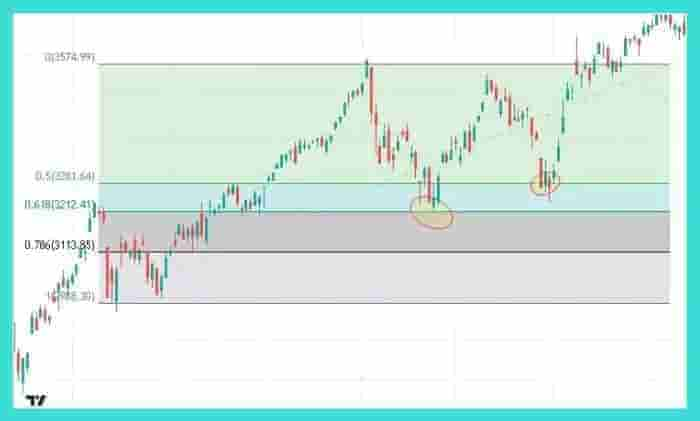
The Fibonacci indicator is used by traders for spotting areas of price reversals in various markets.
Fibonacci is used as an overlay on a price chart. Traders use the Fibonacci by plotting the high and low of a trend and waiting for the price to trade into a Fibonacci level.
The most popular levels used on a Fibonacci retracement indicator are the 50% and 61.8% levels.
In the chart below, the price reverses off the 61.8% level and then the 50% level as highlighted in yellow.
5. On Balance Volume (OBV)
The On Balance Volume indicator measures the buying and selling pressure within a market.
The OBV produces a curving line and the line can be used to confirm the quality of a current price trend or alert a trader to a potential reversal if the indicator diverges from the price action.
The direction of the OBV line is the most important, rather than the figures themselves.
The OBV line should follow in the direction of the price trend. If it doesn’t. this could signal an impending price reversal.
A trader should focus on trying to find divergences between the OBV line and price for potentially buying and selling signals.
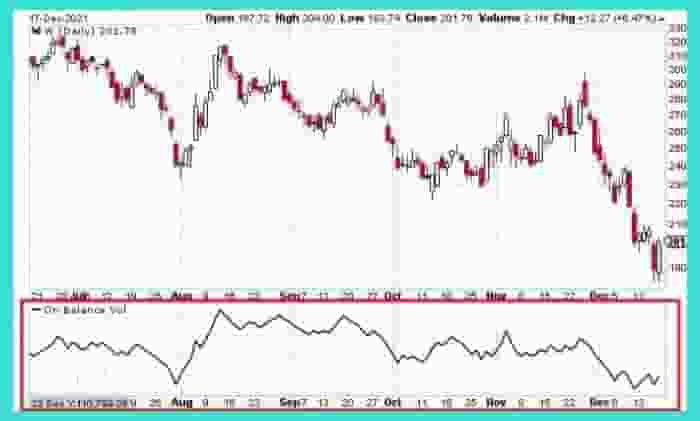
An example of this in action is in the chart below in the month of November. The price trend is rising while the OBV line is sideways.
This is signaling there is not much buying pressure for the bullish price move in November.
6. Average True Range (ATR)
The average true range (ATR) indicator is a technical indicator used to help traders gauge how volatile a market is.
The ATR represents the average daily price movement a market moves within a set number of days. The ATR is averaged out over a predefined number of days, (whatever the trader sets it to).
Usually, the ATR is set to 20 days. A great use case for the ATR is for helping a trader decide where to place a stop loss when managing risk.
If the ATR for a specific stock is 80 cents, then a great stop loss could be to place a stop loss at 80 cents from entry price.
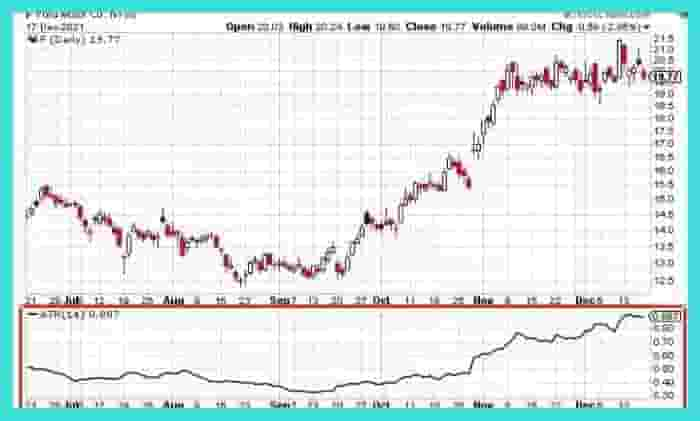
In the below chart example, the ATR is 0.88 which means the ATR is 88 cents over a 14 day period.
Conclusion
The list above are the top technical indicators traders use when trading the market.
Every technical trader should test these indicators by practicing on a demo trading account to see if it could work for their trading style.
A trading simulator will help a trader practice using these technical indicators without risking real trading capital while they learn.
