Technical analysis can assist a trader in finding buying signals or "long trades" in various financial markets.
Knowing how to use technical analysis to find buying signals is useful for any trader looking to buy various financial markets.
To find buying signals by using technical analysis:
- Look for markets where the price is near support levels
- Look for financial markets breaking out of bullish chart patterns
- Check for extreme oversold technical indicator readings in markets
- Look for bullish technical divergences in markets
These technical analysis methods for finding buying signals and long trade opportunities can be applied to any financial market from commodities to stocks.
It can also be applied to any timeframes from shorter 1-minute price charts to longer-term weekly or monthly price charts.
Look For Markets Where The Price Is Near Major Support Levels For Buying Triggers
To find buying signals by using technical analysis, browse through the price charts of various markets and find markets where the price is trading near a major support level.
A support level is a level on a price chart where the price struggles to go lower and could potentially bounce or reverse from a downtrend to an uptrend.
The higher number of times the price touches off a support level, the more important that level becomes for a potential price reversal and buying opportunity.
Buying into a market at or near a support level is a great low-risk entry point for traders.
Below are various visual examples of buying signals in different markets by using support levels as entry points.
Example Of A Buying Trigger At A Technical Analysis Support Level In Stocks

In the above price chart example, there is a clear horizontal support level during a period of price consolidation on the price chart of Dominos stock.
It is a clear horizontal support level as it connects the price swing low levels together with a horizontal line (marked in black).
Traders will use this support level as a buying trigger around this area with a stop-loss placed below the support level.
This is an example of using technical analysis support levels for finding buying signals.
Horizontal support levels are best used for buying signals when the price action in a market is in a period of consolidation or trading sideways.
Example Of A Buying Trigger At A Technical Analysis Rising Support Level
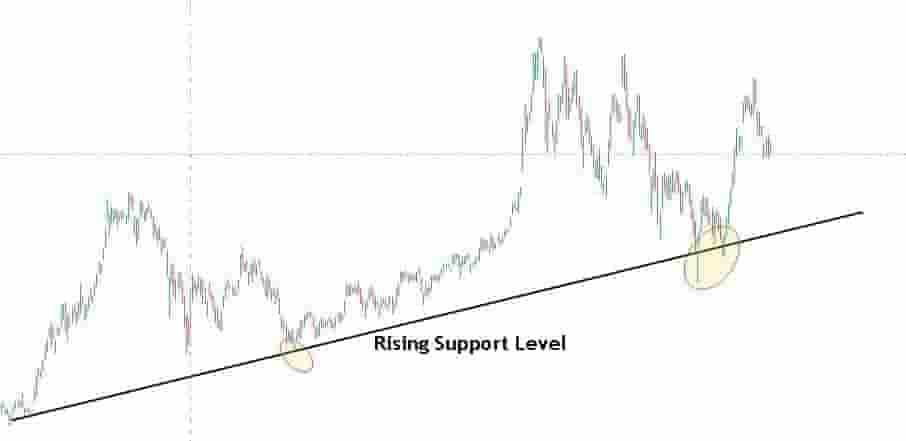
In the above price chart of Tesla stock, there is a clear example of a technical analysis rising support level (marked in black uptrend line).
The rising and uptrend support level is connected by rising price swing low levels, as evident by the highlighted areas in the example above.
As the price of the stock trades down into the rising support level, it immediately reverses and trades higher again.
This technical analysis uptrend support level is an area used in technical analysis to buy with a stop-loss placed just below the rising support level.
Traders use these uptrend support levels to find very low-risk entry points for buying into a market.
Buying at an uptrend support level area works best in a bullish trending market.
Look For Financial Markets Breaking Out Of Bullish Chart Patterns
Another method of using technical analysis to find buying triggers is by searching for bullish chart patterns forming on the price charts of different markets and waiting for the prices to break out of the pattern.
When the price of these markets breaks out of the bullish chart patterns, the breakout levels can be used as buying triggers with low-risk entry points for traders.
Technical analysis bullish chart patterns used for finding buying opportunities in a financial market include:
These are some of the most popular technical analysis chart patterns used for finding buying or long trade signals in a market.
Example Of A Technical Analysis Bull Flag Triggering A Buying Signal
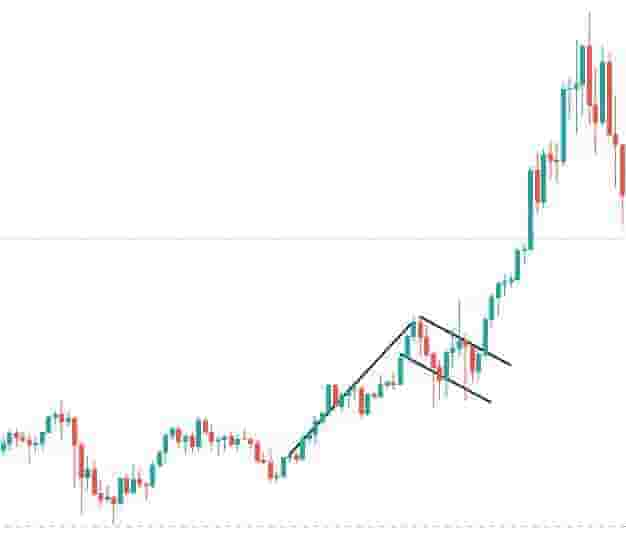
In the above price chart, a technical analysis bull flag forms which triggers a buying signal in the market.
This is a bullish chart pattern that can indicate that the price will continue in a bullish price direction.
Traders use the bull flag chart pattern to find an area to buy into a financial market with a very low-risk level.
Example Of A Technical Analysis Cup & Handle Pattern Triggering A Buying Signal
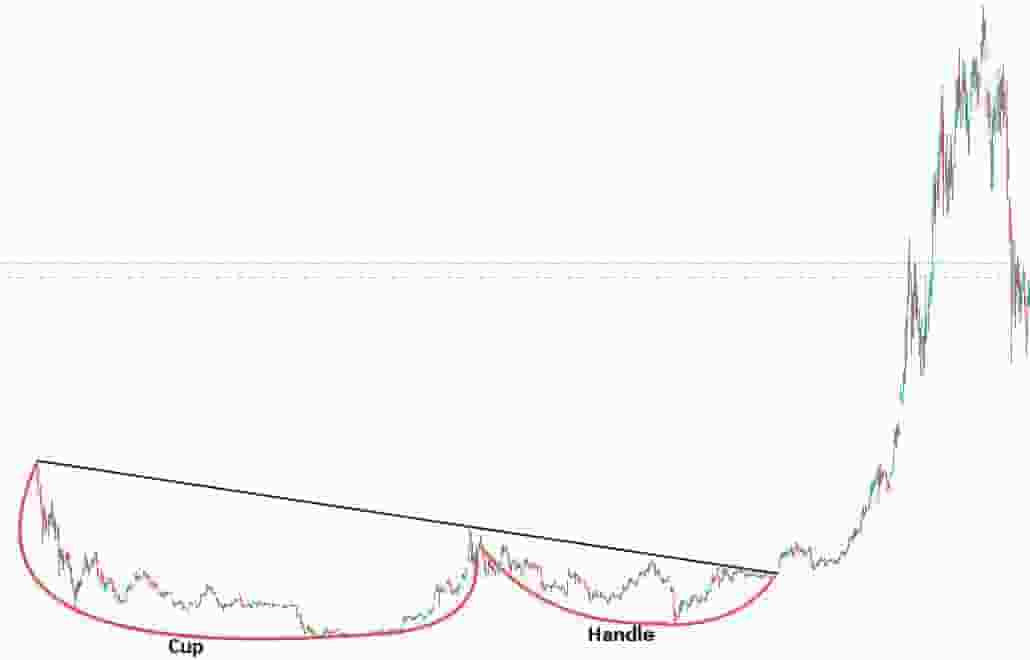
In the above price chart, a technical analysis cup and handle chart pattern forms.
A cup and handle pattern is a pattern used in technical analysis to help traders find buying signals.
It is a signal that the price of the market will increase in price. Traders use the breakout level as a buying point with a low-risk stop level just below as the price breaks out.
The cup and handle pattern is another powerful pattern used in technical analysis to find buying opportunities in various markets where the chart pattern forms.
Example Of A Technical Analysis Ascending Triangle Pattern Triggering A Buying Signal
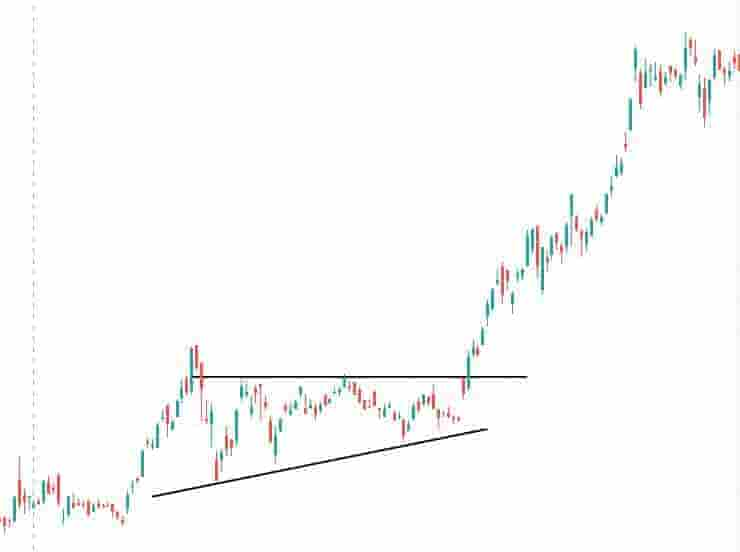
In the above price chart, a technical analysis ascending triangle chart pattern forms.
An ascending triangle is a bullish chart pattern that can form in a financial market.
It signals a buying trigger once the price breaks out of the pattern and it can indicate that the price will continue to rise after it breaks out of the pattern.
Traders frequently use this technical analysis ascending triangle chart pattern as a buy signal in the markets where the pattern forms.
Check For Extreme Oversold Technical Indicator Readings In The Markets
Trades can use technical analysis to find buying signals by checking the technical indicators to see if these trading indicators are showing extreme oversold readings in the markets.
Technical analysis indicators used for finding buying signals include:
- Relative Strength Index (R.S.I.)
- MACD
- Stochastics
These technical indicators can signal the beginning of a rising price trend and a reversal from bearish price action to bullish price action.
Technical indicators are best used as buying signals when they are at oversold levels and are used in conjunction with other technical analysis tools or strategies like the price is at a support level or a bullish chart pattern forms at the oversold level.
Example Of The RSI Indicator Signaling A Buying Setup
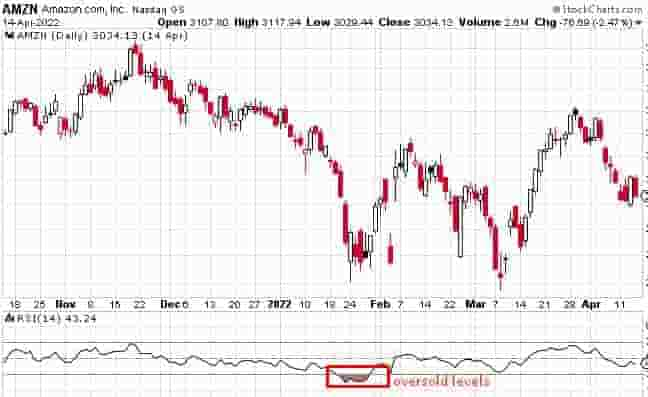
In the above price chart, the technical indicator known as the R.S.I. signals that the market is in an oversold condition.
This signals a potential buying opportunity with a trader anticipating a price bounce for the markets to get out of the oversold conditions on the R.S.I. indicator.
The R.S.I. indicator is best used with other patterns or indicators for signaling buying signals.
Using an R.S.I. on its own without other confirmation signals can be unprofitable.
Example Of The MACD Indicator Signaling A Buying Setup
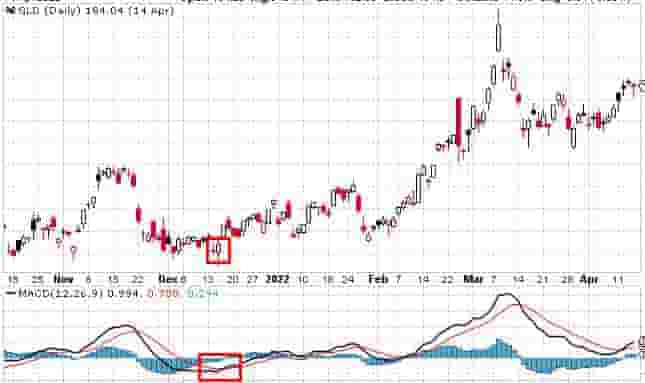
In the above price chart, the MACD indicates that the market is in extremely oversold conditions and that the price might reverse and start to increase.
The MACD, when in oversold conditions, alerts traders to a potential buying opportunity.
Traders using the MACD technical indicator to signal buying opportunities are anticipating the market will bounce in order to get out of the oversold state.
The moving averages within the MACD indicator must cross over to signal that the price may reverse.
Example Of The Stochastics Indicator Signaling A Buying Setup
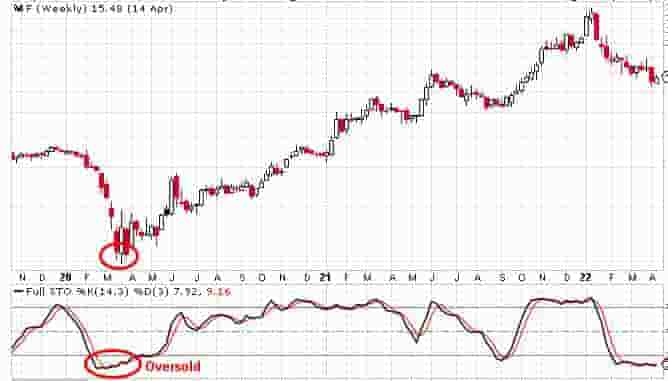
In the above price chart, the stochastics indicator is indicating that the market is in an extremely oversold condition.
Traders will use the stochastics indicator to look for long or buying trades when the indicator is in this oversold state.
They will buy the oversold market in the anticipation that the market price will bounce higher to get out of the oversold state.
Look For Bullish Technical Divergences To Find Buying Triggers In Markets
Another method of using technical analysis to find buying signals in financial markets is by searching for markets where there is a bullish technical divergence between the price and the indicator.
Bullish divergences are also called positive divergences.
A bullish divergence appears when there is a divergence between the direction of the price of an asset and the direction of the technical indicator.
It occurs when the price is moving lower but the technical indicator is not also moving lower.
Example Of A Positive/Bullish Divergence Signaling A Buy Trigger In The Market
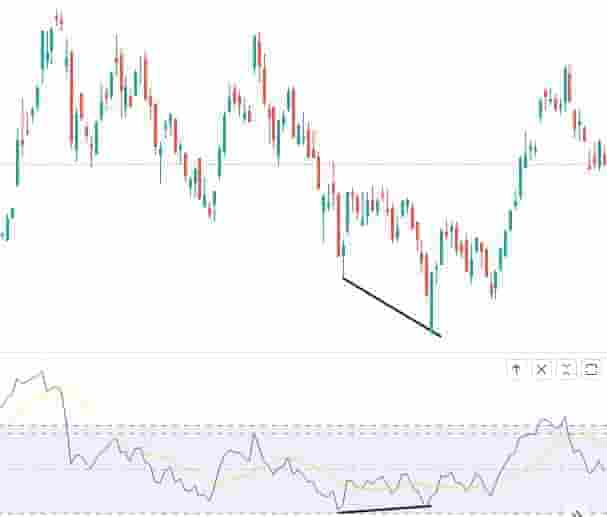
In the above price chart, a positive technical divergence occurs.
This signals a potential bullish price reversal may occur. It forms when the price makes a lower low while the oscillator indicator does not also make a lower low.
These technical divergences are best used in conjunction with other technical analysis methods for finding buying triggers.
Conclusion
In conclusion, traders can use technical analysis as a useful tool for finding very low-risk, high reward buying signals in any capital market.
The most common methods of using technical analysis to find buying signals are by using chart patterns, technical indicators and looking for bullish technical divergences in the markets to help find buy alerts.
Typically, a trader will use more than one method together to increase the odds or probability that a bullish signal will be profitable.
Beginner traders find that using chart patterns is the best first step to learn for finding buying triggers, followed by using technical indicators and then technical divergences.
