What Is A Rounding Bottom Chart Pattern?
In technical analysis, a rounding bottom pattern, also known as a "saucer bottom", is a bullish reversal chart pattern that forms at the end of a bearish downtrend. The pattern is shaped like the letter "U" and it signals that the price of a market will reverse from bearish and declining prices to bullish and rising prices.
During the forming of the rounding bottom, the volume level declines as price forms the U shape before increasing as it breaks out from the pattern.
Rounding Bottom Pattern Components
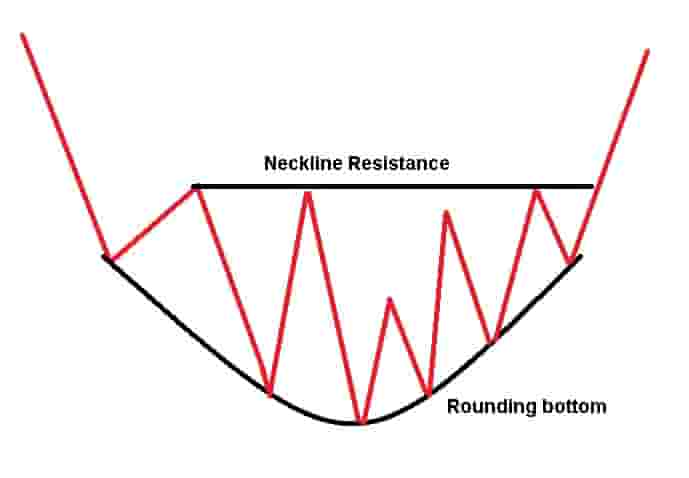
In order to identify a rounding bottom pattern, there will need to be two components visible on the price chart of a financial market.
The two components of the rounding bottom pattern are:
- Rounding bottom: This is the "U" shape or the rounding bottom that connects the price action together as it moves in the shape of the letter U
- Neckline resistance level: The resistance level of the rounding bottom is called the "neckline". It is typically the area where traders will enter into buy positions if the price breaks out from this level
Drawing a rounding bottom pattern will mean that both these components of the rounding bottom and the neckline resistance level will need to be annotated onto the chart together.
Rounding Bottom Chart Pattern Examples
Below are visual examples of the rounding bottom chart pattern.
Example Of A Rounding Bottom Pattern In The Stock Market
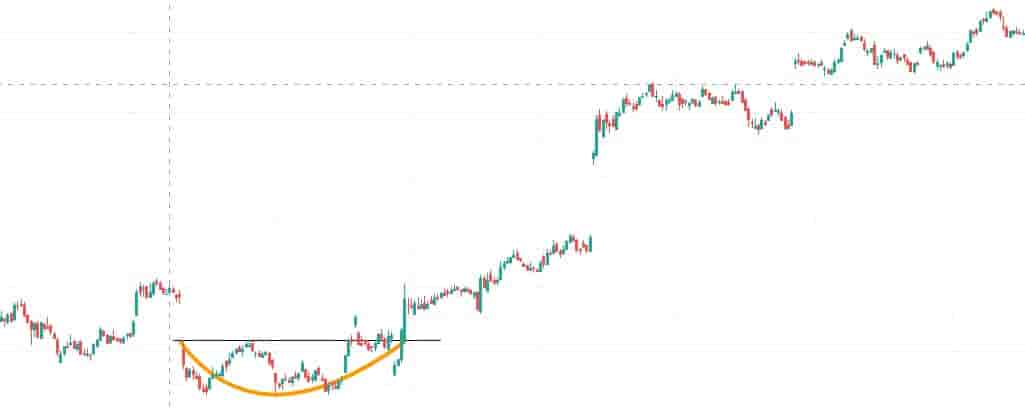
In the daily price chart of Netflix stock, a rounding bottom pattern formed. It leads to a very large bullish trend after the price breaks out from the rounding bottom resistance level.
This is an example of how a successful rounding bottom pattern looks in the stock market.
Example Of A Rounding Bottom Pattern In The Forex Market
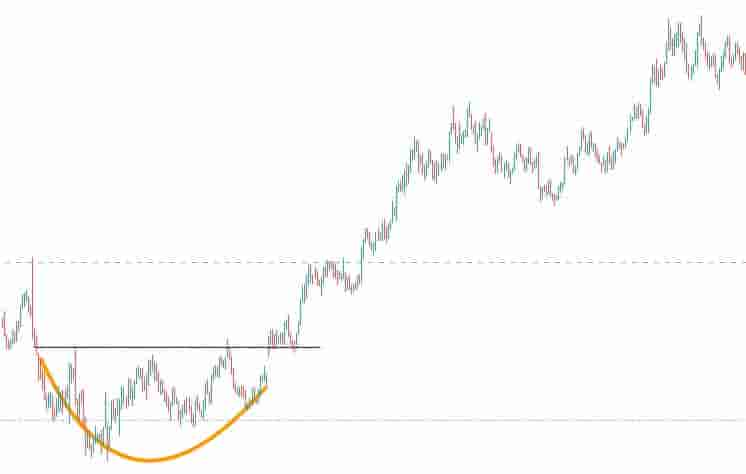
In the daily price chart of EUR/USD, a rounding bottom pattern formed. It signaled a reversal from a bearish trend to a bullish trend and the price of the currency pair increased to much higher levels when the price breaks out of the resistance level.
This is a clear example of a successful rounding bottom pattern in the forex market.
Example Of A Rounding Bottom Pattern On A Shorter Timeframe Price Chart
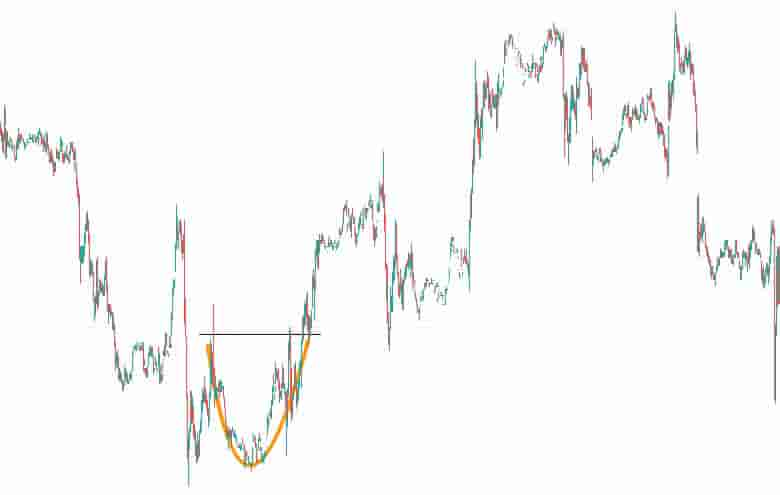
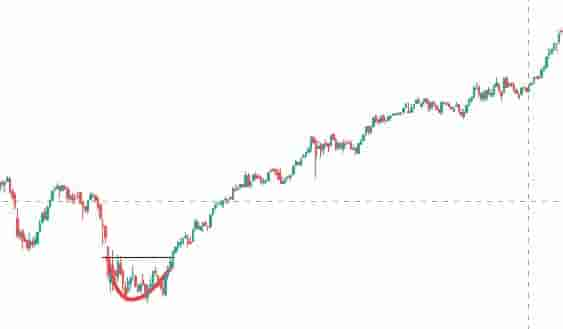
In the 5-minute price chart of Corn futures above, a rounding bottom pattern formed.
It resulted in a reversal from declining prices to rising prices once the price breaks out above the pattern resistance level.
Typically, day traders and scalpers will trade the rounding bottom pattern on the shorter timeframe charts.
Example Of A Rounding Bottom Pattern On A Higher Timeframe Price Chart
In the weekly chart of Apple stock above, a rounding bottom pattern formed. Once the price breaks out of the pattern resistance level, it leads to a multi-year bull run in the price of Apple stock.
The rounding bottom patterns can also be applied to higher timeframe price charts as evident from the price chart above.
How To Find Rounding Bottom Patterns
The methods for finding rounding bottom patterns in the markets are:
- Browse through price charts manually: A trader can find rounding bottom patterns by manually scrolling through the price charts to try and find them.
- Use a rounding bottom scanner: A trader can use a rounding bottom chart pattern scanner to automatically scan for rounding bottom patterns.
- Follow CMT's on Twitter: New traders can follow chartered market technicians on Twitter and wait for them to post chart patterns including rounding bottoms on their Twitter feeds.
Rounding Bottom Pattern Benefits
The benefits of rounding bottom patterns are:
- It helps to capture large price trends: A rounding bottom pattern can help a trader find the beginning of a large bullish price trend in the market.
- It is easy to learn: A rounding bottom pattern is easy to learn as it looks like the letter "U" shape on a price chart.
- Reward to risk ratio can be high: When the price breaks out of the rounding bottom pattern, it can lead to a large move which means the reward to risk ratio can be high e.g. risking $1 to make $3+.
- It works in all markets: A rounding bottom works in all financial markets and is not limited to working in only a few markets.
- It works on any timeframe: A rounding bottom pattern can form and be traded on any timeframe chart and is not restricted to working on only a few timeframes.
Rounding Bottom Pattern Limitations
The limitations of rounding bottom patterns are:
- They can fail: A rounding bottom pattern can and will fail as no chart pattern is accurate 100% of the time.
- Risk level can sometimes be unclear: In some instances, setting the stop-loss level at the right area if the pattern forms in a choppy and volatile market environment.
Rounding Bottom Formation Duration
The length of time rounding bottom patterns take to form will depend on the timeframe of the price chart used.
Example durations for a rounding bottom pattern to form include:
- 30 hours minimum for a rounding bottom pattern to form on an hourly price chart.
- 30 days minimum for a rounding bottom pattern to form on a daily price chart.
- 30 weeks minimum for a round bottom pattern to form on a weekly price chart.
Frequently Asked Questions About The Rounding Bottom Pattern
Below are frequently asked questions about the rounding bottom chart pattern.
Is A Rounding Bottom Pattern Bearish?
No. A rounding bottom pattern is a bullish chart pattern that signals that the price may reverse from declining and instead go higher once the pattern is completed.
Is A Rounding Bottom Pattern A Continuation Pattern?
No. A rounding bottom pattern is a bullish reversal pattern meaning it signals that the price will reverse from a bearish trend to a bullish one.
What Price Chart Timeframes Can A Rounding Bottom Pattern Form On?
A rounding bottom pattern can form on any price chart on any timeframe from short timeframe charts to high timeframe charts.
What Is The Difference Between A Rounding Bottom And A Rounding Top Pattern?
The differences between a rounding bottom pattern and a rounding top chart pattern are:
- It's shape: A rounding bottom pattern is shaped like the letter "U" whereas a rounding top pattern is shaped like an upside-down letter "U".
- What it signals: A rounding bottom pattern signals that the price of a market will reverse from bearish price action to bullish price action . A rounding top indicates that the price of a market will reverse
from bullish price action to bearish price action.
