Technical analysis can be used as a method of reading, understanding and interpreting the price charts in the cryptocurrency markets. It can help a trader to predict the future price movements of various cryptocurrencies.
To use technical analysis in the cryptocurrency markets:
- Use free technical analysis charting tools: Use free charting software providers with technical analysis tools for free.
- Browse for chart patterns: Look through cryptocurrency price charts and try and find chart patterns.
- Browse for candlestick patterns: Use Japanese candlestick charts to find candlestick patterns that help provide buying triggers.
- Use technical indicators: Technical indicators like the RSI or Keltner channels can help traders to read price charts in cryptocurrencies.
- Read technical analysis reports: Browse through Twitter or various financial forums to find technical analysis reports by technical analysts on various markets including cryptocurrency markets.
These are free and simple methods of using technical analysis in any cryptocurrency market from Bitcoin to Ethereum.
Use Free Technical Analysis Charting Tools
To use technical analysis in the cryptocurrency markets, a new trader will need access to a charting provider.
Charting providers offer access to cryptocurrency price charts, technical analysis tools, indicators and scanners.
Popular free charting tools that provide access to cryptocurrency charts and technical analysis indicators include:
- TradingView
- Investing.com
- StockCharts.com
These providers all have a free tier that will give new traders all the tools needed to do technical analysis on any cryptocurrency market.
Browse Cryptocurrency Price Charts For Chart Patterns
Browse through the various price charts of cryptocurrency and look for common chart patterns used in technical analysis.
Popular technical analysis chart patterns to use in cryptocurrency markets include:
- Cup & Handles
- Wedges
- Bull Flags
- Triangles
These chart patterns can help a trader find buying opportunities in cryptocurrencies by simply applying these technical analysis principles.
Example Of Using A Technical Analysis Cup & Handle Pattern In Bitcoin
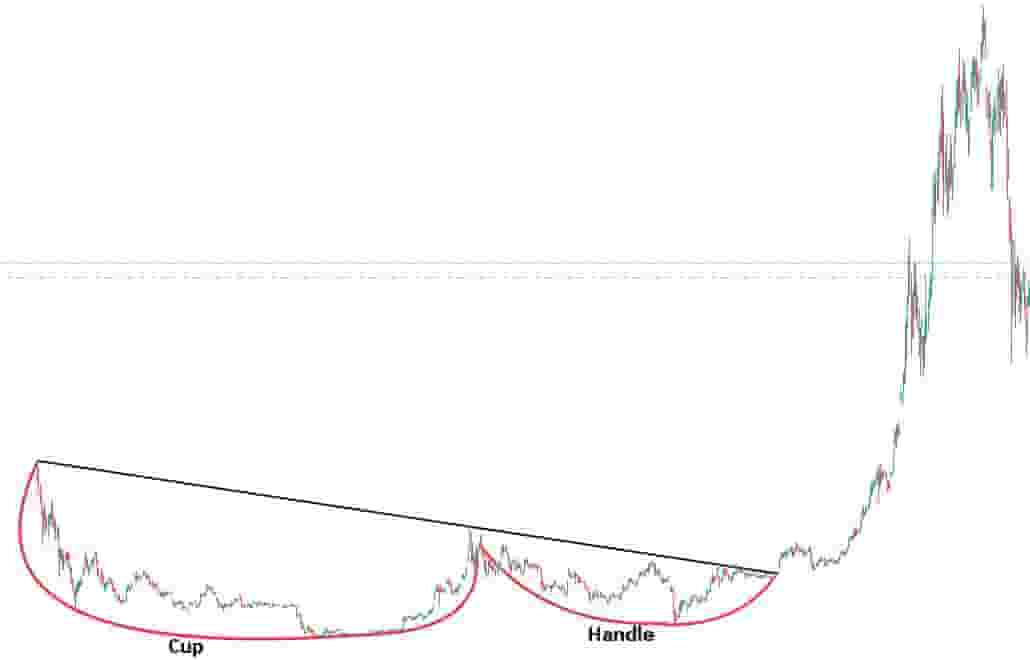
In the above price chart of Bitcoin, a cup and handle chart pattern formed in 2020.
It signaled a great buying signal at the breakout point which led to a huge price increase in Bitcoin.
This is a simple example of using the technical analysis chart pattern known as the cup and handle in the cryptocurrency markets.
Example Of Using A Technical Analysis Wedge Pattern In Solana
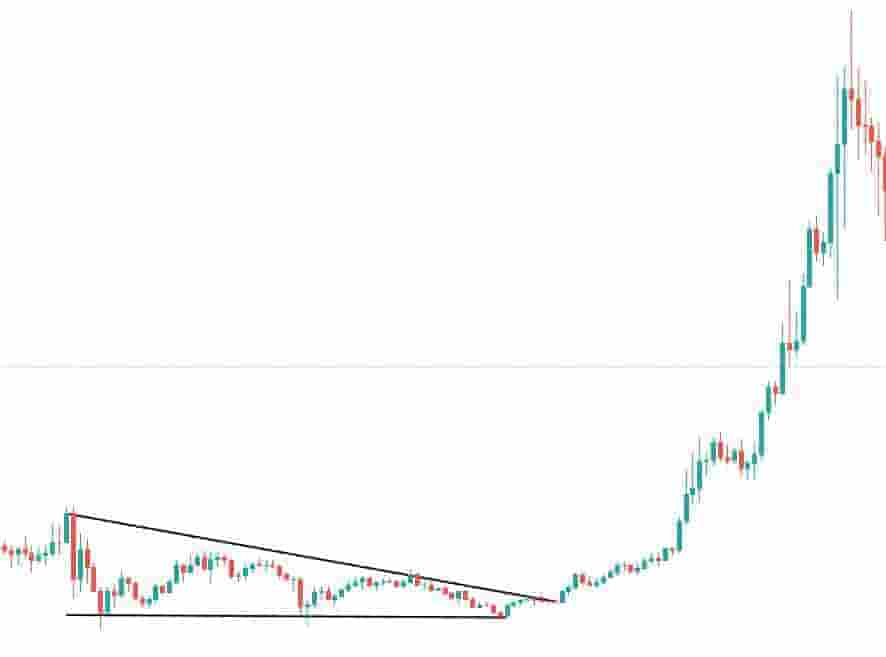
In the above price chart of Solana, a technical analysis wedge chart pattern formed.
It signaled a large bullish move in the prices after it had a breakout from the wedge pattern.
This is an example of using the technical analysis chart pattern called a wedge in the cryptocurrency markets.
Example Of Using A Technical Analysis Bull Flag Pattern In Ethereum
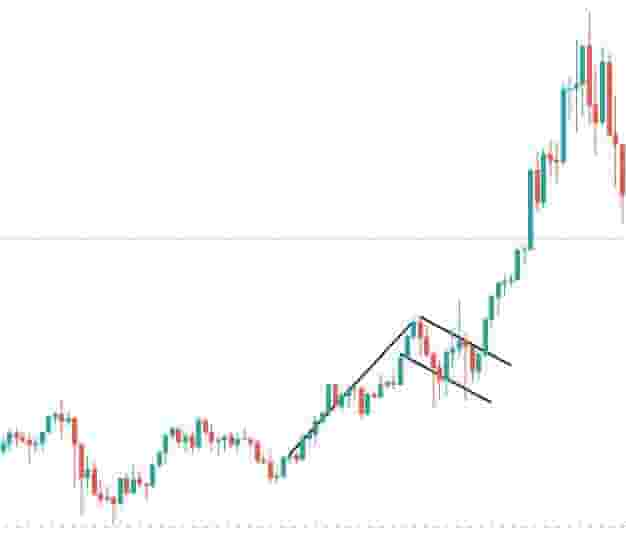
In the above price chart of Ethereum, a technical analysis bull flag formed.
It signaled a steep and rapid price increase after the pattern was completed and the price of Ethereum broke out from the flag.
This is an example of using the technical analysis chart pattern known as a bull flag in the cryptocurrency markets.
Example Of Using A Technical Analysis Triangle Pattern In XRP
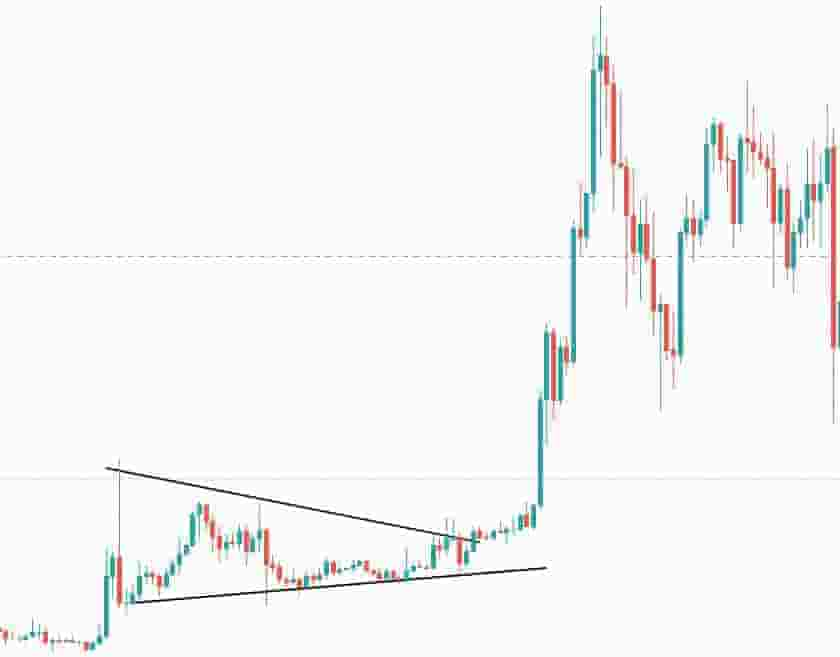
In the above price chart of XRP, a technical analysis triangle pattern formed.
It signaled a large bullish price trend move after it broke out from the triangle pattern.
This is an example of using the technical analysis chart pattern called the triangle in the cryptocurrency markets.
Browse Cryptocurrency Candlestick Price Charts For Candlestick Patterns
Browse through the candlestick price charts of cryptocurrencies and look for popular candlestick patterns.
Popular technical analysis candlestick patterns to use in cryptocurrency markets include:
- Bullish Engulfing
- Hammer
- Inverted Hammer
These technical analysis candlestick patterns can help traders find buying opportunities in cryptocurrency markets
Example Of Using A Technical Analysis Bullish Engulfing Candlestick Pattern In XRP
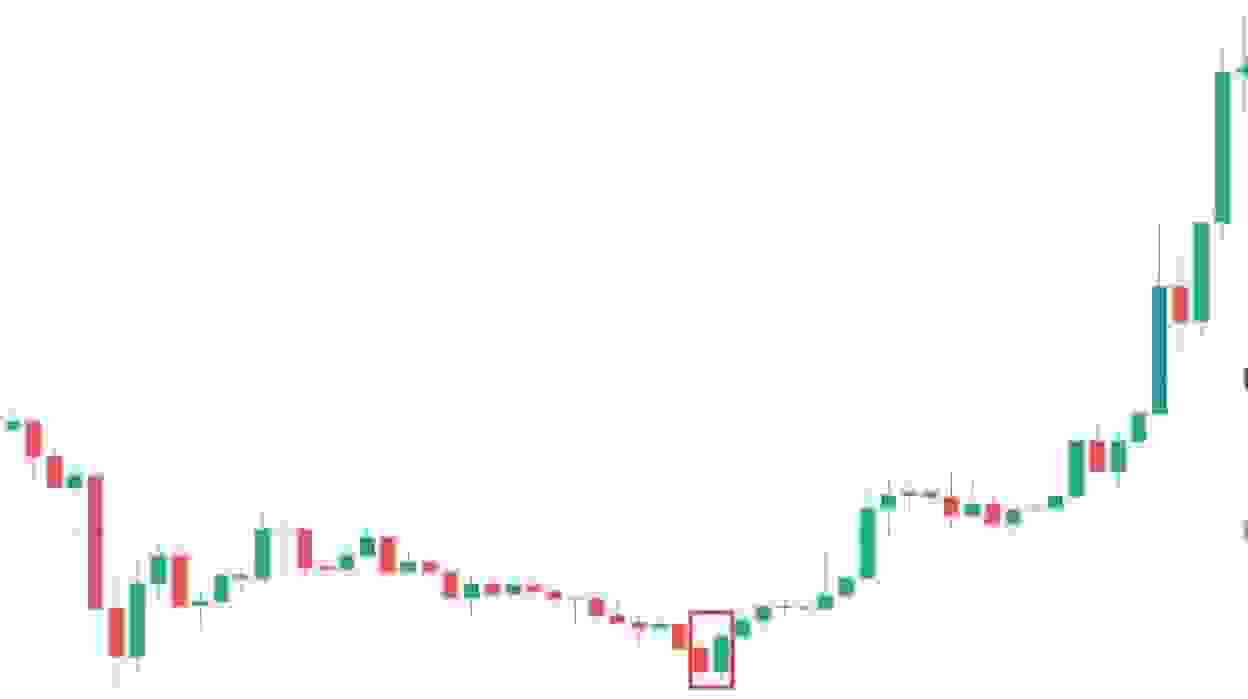
In the above price chart of XRP, a bullish engulfing candlestick pattern forms.
It signaled a large bullish price move after a previous downtrend in the market.
This is an example of using the technical analysis bullish engulfing candlestick pattern in the cryptocurrency markets.
Example Of Using A Technical Analysis Hammer Candlestick Pattern In Luna
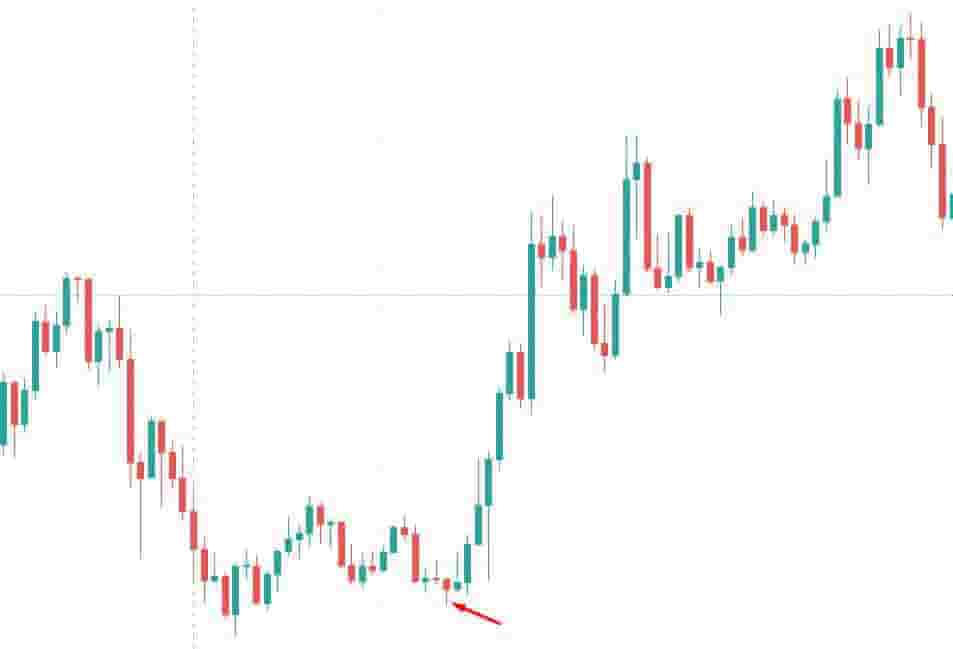
In the above candlestick price chart of Luna, a bullish hammer candlestick pattern formed that signaled a big bullish price move.
This is an example of using the technical analysis bullish hammer candlestick pattern in the cryptocurrency markets.
Example Of Using A Technical Analysis Inverted Hammer Candlestick Pattern In Bitcoin
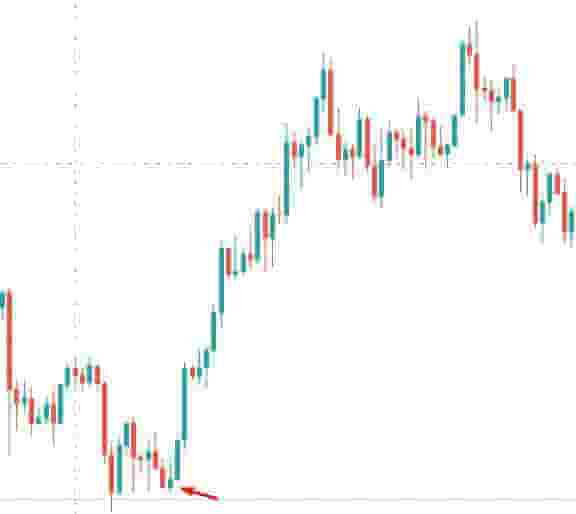
In the above candlestick price chart of Bitcoin, a bullish inverted hammer candlestick pattern forms that results in a large increase in price in the market.
This is a simple example of using the technical analysis inverted hammer candlestick pattern in the cryptocurrency markets.
Use Technical Analysis Indicators In The Cryptocurrency Markets
Choose a technical indicator to help read and interpret the price action in the cryptocurrency markets.
Popular technical analysis indicators to use in the cryptocurrency market include:
- Relative Strength Index (RSI)
- Bollinger Bands
- Moving Averages
These technical analysis indicators can help traders find buying opportunities in various cryptocurrency markets.
Example Of Using The R.S.I Technical Analysis Indicator In Bitcoin
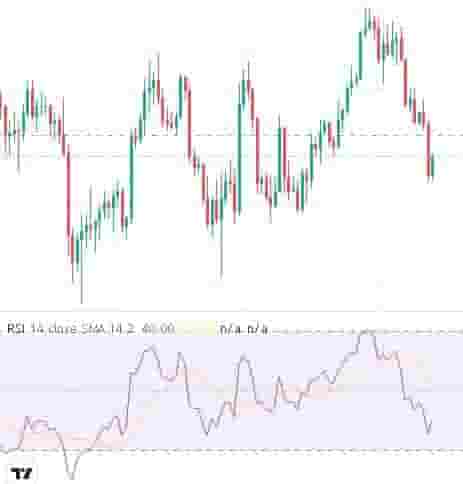
In the above chart of Bitcoin, there is an R.S.I. technical analysis indicator placed below the price chart.
The R.S.I. is a simple technical analysis indicator used to measure overbought and oversold conditions and it can be used in any cryptocurrency market.
Example Of Using The Bollinger Bands Technical Analysis Indicator In Ethereum
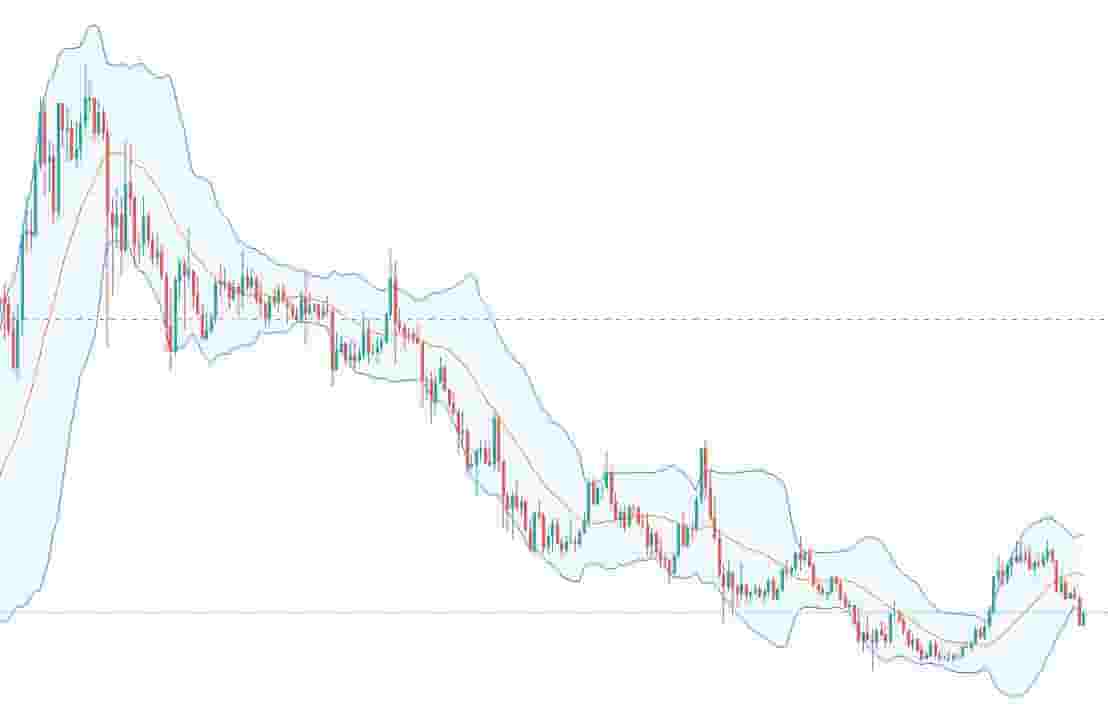
In the above price chart of Ethereum, there is a Bollinger band technical indicator overlaid on the chart.
The Bollinger bands helps measure when markets are extremely volatile, extended or in a price consolidation period.
They can be used in the cryptocurrency markets.
Example Of Using The Moving Averages Technical Analysis Indicator In Ethereum
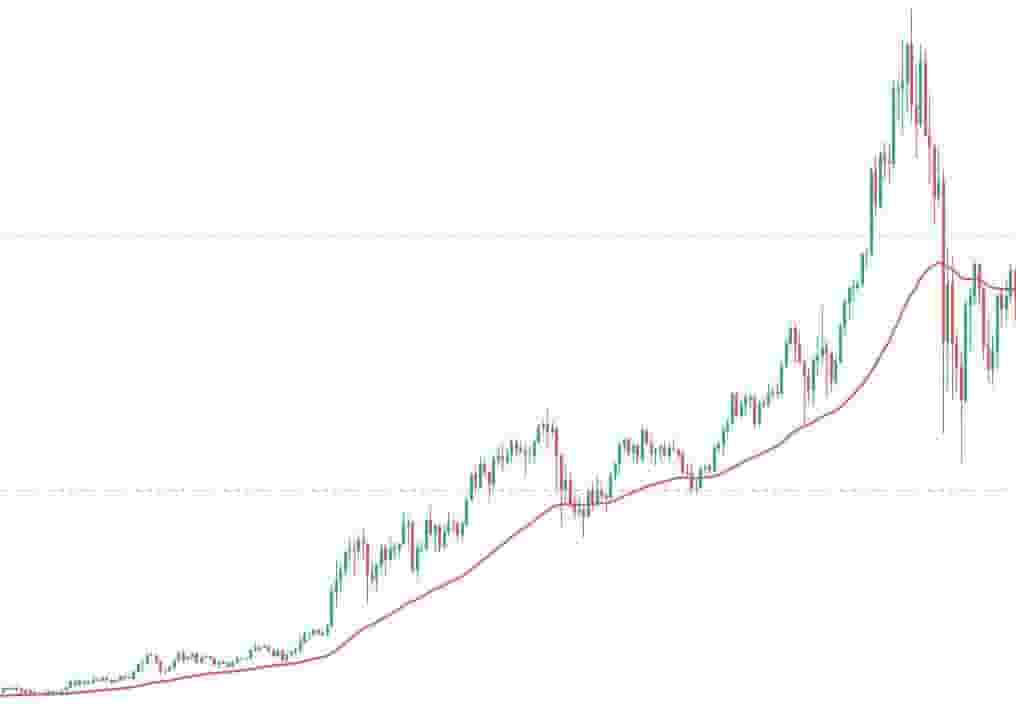
In the above price chart of Ethereum, there is a technical analysis moving average indicator.
The moving average indicator can be used in any financial market including cryptocurrencies.
Read Technical Analysis Reports
The final way to use technical analysis in the cryptocurrency market is to read technical analysis reports on cryptocurrencies by technical analysts.
Technical analysis reports will offer real-time technical analysis studies of various cryptocurrency markets.
Reading technical analysis reports in the cryptocurrency markets will offer new traders:
- Technical Analysis Insights: Technical analysis reports offer insights on how professional traders and technical analysts use technical analysis to read the cryptocurrency markets.
- A Professionals Understanding: These technical analysis reports are created by professional traders and technical analysts so new traders can easily see what the pros are seeing.
A technical analysis report can be found on various chartered market technician's Twitter accounts or on the CMT association website.
Summary
In summary, technical analysis can be used to analyze the price charts of the cryptocurrency markets and provide logic to the price action in various cryptocurrencies.
Using common technical analysis methods like chart patterns, candlestick patterns and technical indicators can help a new trader with understanding how to read and interpret the market.
