Day trading indicators can help any day trader improve their trading.
There are many good trading indicators that are particularly useful for day trading in many markets from forex to stocks and futures.
The 6 best day trading indicators are:
These indicators help day traders trade the market intraday.
1. Volume Weighted Average Price (VWAP)
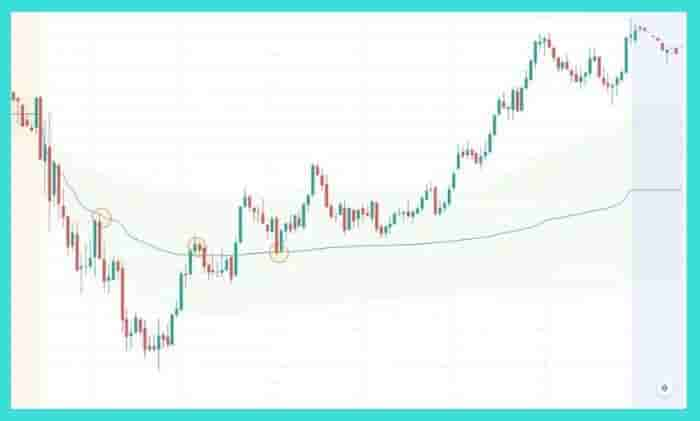
The volume weighted average price (VWAP) is an indicator used regularly in many day trading strategies by day traders.
The VWAP provides a trader with the average price of a market based on both price and volume.
It is illustrated as a single line overlaid on price charts.
Why The VWAP indicator Is Great In Day Trading
The VWAP indicator is good to use in day trading because:
- It can act as a support or resistance area: The VWAP regularly acts as an intraday area of support or resistance where day traders can position around the VWAP level.
- Can represent larger traders’ average price: The VWAP is the volume weighted and can indicate the average price of larger traders in the market. This can be useful information for smaller day traders wanting to position themselves similarly to larger traders.
- Can be used as a trailing stop loss area: If using an intraday trend-following strategy, the VWAP can be a great area to trail a stop-loss order.
2. Bollinger Bands
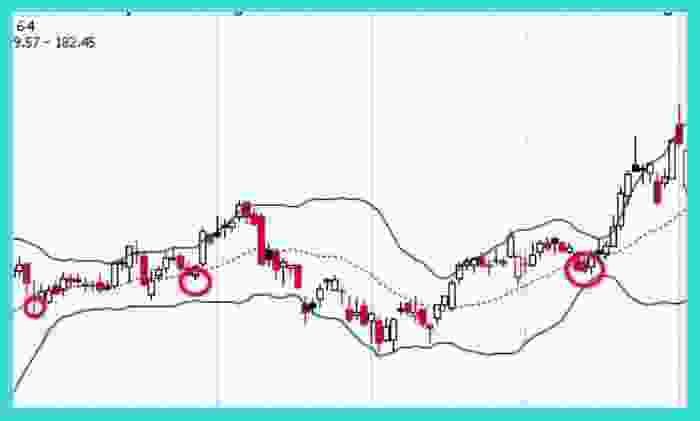
Bollinger bands are an overlay indicator with 3 moving average lines. These are known as the upper band, the middle band and the lower band.
Bollinger bands are used to spot when markets are in a price consolidation and preparing to break out of a range.
They are also used to find support levels in up trends and resistance levels in downtrends.
Why Bollinger Bands Are A Good Indicator In Day Trading
Bollinger bands are a good indicator to use in day trading because:
- They help day traders spot new trends forming: A Bollinger band indicator can help day traders find new trends forming when price breaks the upper or lower bands for a tight range.
- They can act as buying and shorting entries for day trading: The bands can act as support or resistance levels and day traders use the Bollinger band levels as buying and shorting signals.
- They can act as price target levels: Bollinger bands can help a day trader set profit targets for their intraday trades and routinely use upper or lower Bollinger bands as price targets.
3. Support/Resistance Scanner
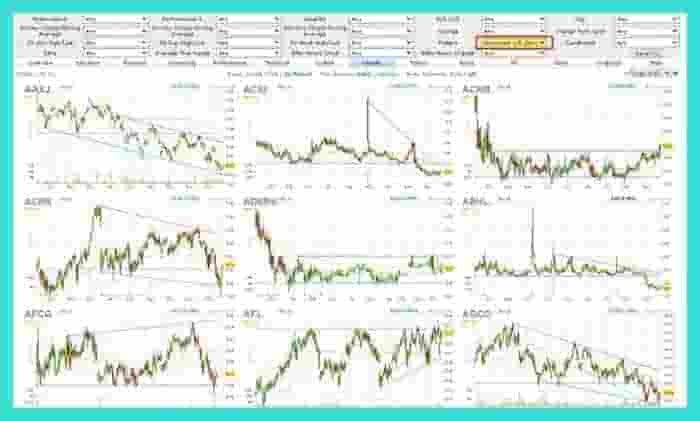
The support/resistance scanner indicator helps day traders find markets that are trading near support/resistance levels.
Why A Support/Resistance Scanner Is A Top Indicator In Day Trading
A support/resistance scanner is a great indicator to use in day trading because:
- It helps day traders find areas where prices can reverse in a market: Support and resistance levels are prominent areas where the price can reverse in markets.
- They mark areas with lots of stop-loss orders: These levels are generally where lots of stop-loss orders are. Day traders can use this information to their advantage by waiting to see how price reacts around these levels.
- They help a day trader with managing risk: Knowing a clear area of support or resistance means a day trader will have a better understanding of where to place stop-loss orders.
4. Aroon Indicator
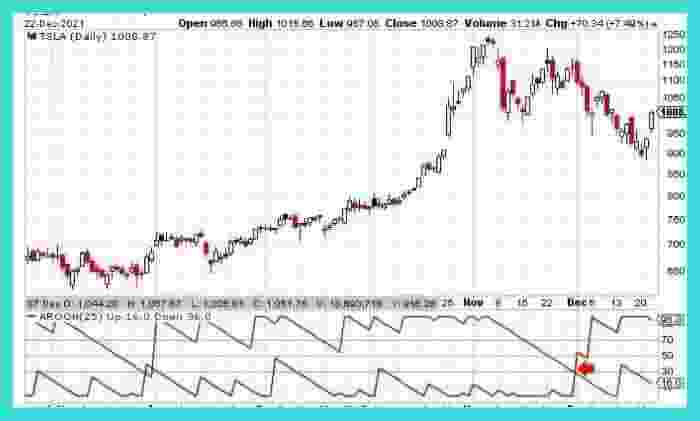
The Aroon indicator helps day traders spot intraday trend changes and reversals. It can be used in any market
The indicator consists of two lines, an up line and a down line. When the up line crosses above the downline, it indicates bullish price action.
When the down line crosses below the upline, it indicates bearish price action.
Why Is The Aroon Indicator Useful In Day Trading
The aroon indicator is good for day trading because:
- It can signal potential price trend changes: When the lines cross above or below each other, it can signal potential trend reversal or change in price action.
- It can help a day trader take profits: When the indicator crosses over, it can signal a day trader should take profits.
- It helps day traders to catch large trends: The Aroon indicator can assist with trend trading intraday. The indicator can keep a day trader holding a trading position for longer than they normally would.
5. Ichimoku Cloud
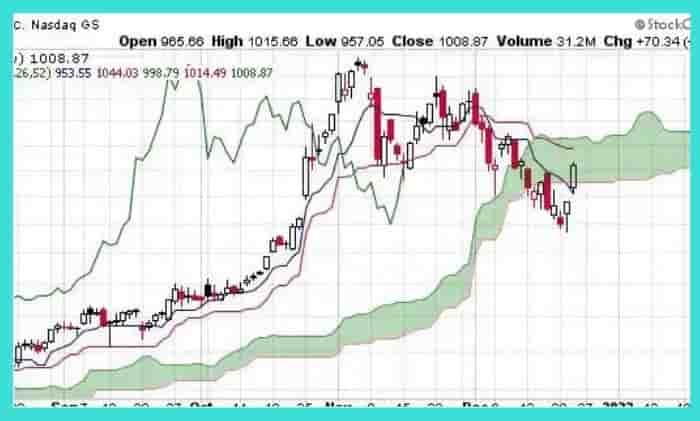
The Ichimoku Cloud indicator is an overlay type indicator that day traders use to trade different markets.
The ichimoku cloud identifies potential trends forming, areas of support and resistance, momentum and
Why The Ichimoku Cloud Is A Great Day Trading Technical Indicator
Using the Ichimoku Cloud indicator in day trading is great because:
- It provides trading entries in any market: The Ichimoku cloud indicator can be applied intraday to any market.
- The clouded area of the indicator can act as support/resistance: The cloud part of the indicator can be used as a support or resistance area when the markets are trending.
- It can help traders build a trading strategy: The Ichimoku cloud can be used as the foundation for building a day trading strategy.
6. Fibonacci Extensions
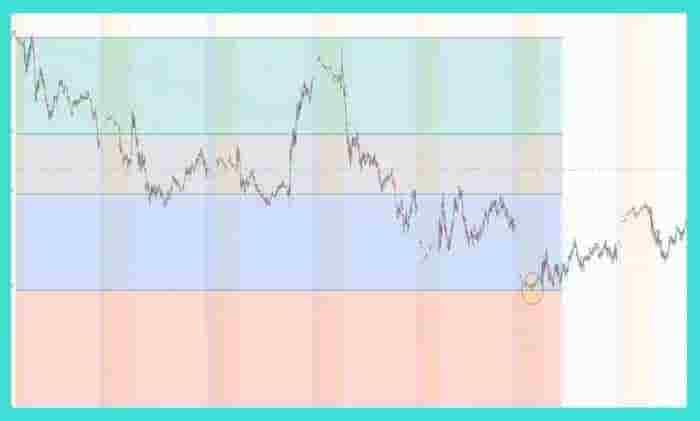
The Fibonacci extension is an overlay indicator used by day traders to set price targets on intraday trades or for trade entries.
These levels are extended Fibonacci levels
Why Fibonacci Extensions Are A Great Day Trading Indicator To Use
Fibonacci extensions are a great trading indicator to use in day trading because:
- They help day traders set price targets: Plotting the fib extensions means day traders can pick price targets easily without confusion.
- They signal potential price reversals: The fib extension levels can signal price reversals making them a great indicator for finding buying and shorting signals.
- They can be used on multi-timeframe intraday charts: Day traders use fib extensions in multiple timeframes from 1 minute to 1-hour price charts to find the confluence of levels which increases the probability of a profitable trade.
Frequently Asked Questions About Day Trading Indicators
Below are frequently asked questions about day trading technical analysis indicators.
Do Professional Day Traders Used Trading Indicators?
Yes, professional day traders use day trading indicators to help them trade any markets. This is evident by some of the successful day traders profiled in the Market Wizard books (1).
Will These Day Trading Indicators Make Me Rich?
A trading indicator is only as good as the trader that uses it. No day trading indicator can guarantee profits or riches.
The trading indicators can help a day trader read the markets and make their own trading decisions.
Do Day Trading Indicators Work?
Day trading indicators can work depending on the day trader that applies them. Research papers have been conducted on backtesting day trading technical analysis strategies and the results have been promising with some indicators offering consistently profitable signals (2).
