Some traders have developed a trading strategy around trading false breakouts.
A false breakout can signal a price reversal in the price action of a financial market meaning it can offer a great reward to risk ratio on trades.
Learning how to trade a false breakout strategy can be advantageous for a trader.
A false breakout, also known as a "failed breakout", is when the price of a financial market breaks out of a chart pattern or through a support or resistance level and fails to continue in the same direction
A false breakout can trap a lot of breakout traders in the wrong position that they will have to liquidate.
This means that there can be a lot of opportunities to trade false breakouts and develop trading strategies around false breakouts.
False Breakout Trading Strategy Steps To Follow
Follow the steps of the false breakout trading strategy below:
- Scan the market for chart patterns
- Wait for the price to break out of the pattern
- Watch the price action and volume as it breaks out
- Enter the trade if the price stalls at the breakout level
- Put stop-loss at the breakout high/low
- Place price target at a big support/resistance level
This is a simple false breakout trading strategy that even a beginner trader can learn.
Essentially, a trader following this trading strategy is trading against the traditional breakout strategy.
1. Scan The Market For Chart Patterns
The first step in the false breakout trading strategy is to scan the markets and find chart patterns.
The chart patterns most commonly used in the false breakout trading strategy are:
Use a chart pattern scanner to find these chart patterns on the price charts of various financial markets.
A free chart pattern scanner like the Finviz chart pattern scanner is more than enough to find these patterns.
False breakout traders do not trade these patterns in the traditional way of trading them on a breakout or break down but traders instead wait to see will the patterns fail to break out.
A trader uses these chart patterns to watch for false breakouts in the next step.
2. Wait For The Price To Break Out Of The Pattern
The second step in the false breakout trading strategy is to wait for the price of the market where the chart pattern forms to break out of the chart pattern.
The breakout area will create an influx of breakout traders that buy or short hoping that the trade will continue to break out to the upside or downside.
3. Watch The Price Action And Volume As It Breaks Out
The third step is to watch the price action and check the volume as the price of the market breaks out of the chart pattern.
If there is little volume as the price breaks out, this can be a telltale sign that it might be a false breakout.
If the price cannot sustain itself above or below the breakout point, it's an indication that a potential trade entry is near for the false breakout trading strategy.
4. Enter The Trade If The Price Stalls At The Breakout Level
The fourth step is to enter the trade if the price initially breaks out or breaks down and then begins to return to the breakout level.
The entry point for a false breakout trading strategy is when the price returns to the breakout level and fails the breakout.
A trader should seek to enter as close to the breakout level of the chart pattern as possible.
For example, if the price of a chart pattern breakout level is $100 and the price breaks out to $102, then fails and trades back to $100, a false breakout trader should seek to short the failed breakout as close to the $100 price level as possible.
5. Put The Stop-Loss At The Breakout Swing High/Low
The fifth step happens after entering a failed breakout trade. The stop-loss should be placed at the swing high or the swing low of the breakout.
For example, if the breakout point is $100 and the price trades to $102 before trading back down below $100, a short trade will be entered near the $100 and the stop-loss will be placed at the $102 i.e. the swing high in this example.
6. Place The Price Target At A Big Support/Resistance Level
The sixth step is to place profit targets at major levels of resistance of support or resistance.
A trader should identify a big area of support or resistance to set the price to take profits.
False Breakout Trading Strategy Rules
Every trading strategy has rules that a trader should follow. The rules of the false breakout trading strategy are:
- Do not risk more than 1% of trading capital per trade: A trader should not risk more than 1% of their capital on any single trade when using the false breakout trading strategy.
- Avoid making more than 3 entry attempts on the same trade: Avoid taking more than 3 entry attempts for the same trade helps to prevent a trader from getting caught in choppy sideways price action.
- Always know the stop-loss price and the take profit price before entering a trade: A trader should know exactly where the stop-loss and price targets are before entering a trade when they're not emotionally involved.
- Avoid taking a false breakout trading setup during or near important market news announcements: A trader should avoid taking a false breakout setup before or during important news announcements as a news announcement can cause extreme volatility e.g. earnings releases, Fomc meetings etc.
These rules help protect a trader from large losses when trading the strategy.
While they are not a guarantee that large losses won't occur, they can help limit the losses in most cases.
False Breakout Trading Strategy Chart Examples
Below are visual price chart examples of entering a trade, placing stop-losses and setting price targets in the false breakout trading strategy.
Example Buy Entry With The False Breakout Trading Strategy

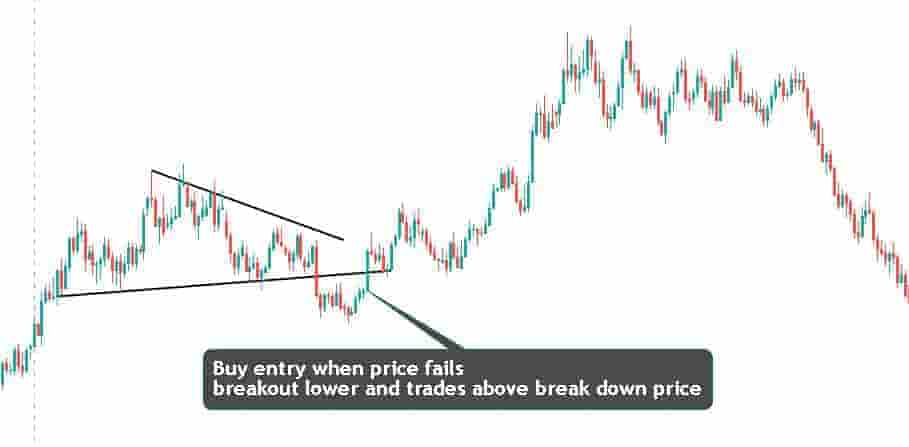
In the price chart above, a buy entry is triggered when the price of the market breaks down and then fails to continue the breakdown.
The buy entry price is when the price of the market bounces and trades back above the breakdown price.
This is an example of a buy entry using the false breakout trading strategy.
Example Short Entry With The False Breakout Trading Strategy

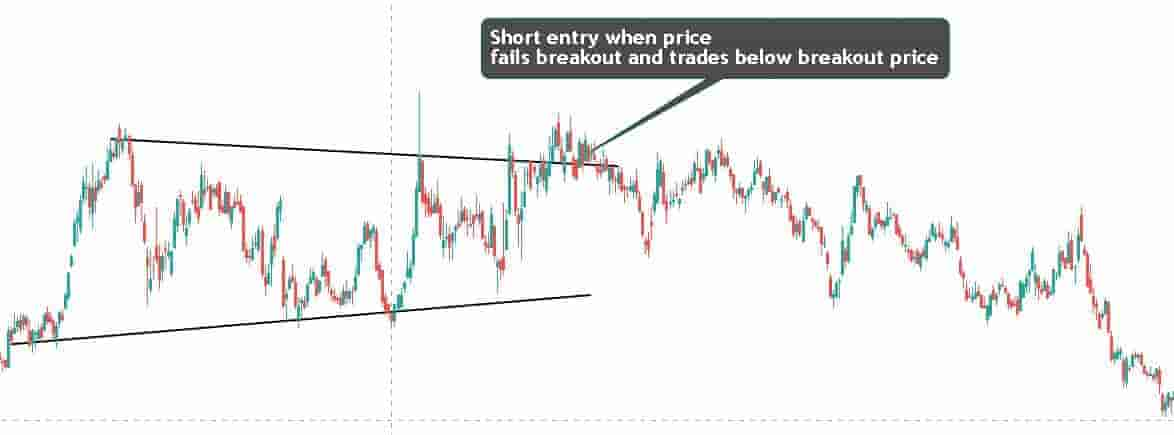
In the above price chart, an example short entry occurs when the price breaks out of the chart pattern and fails.
The short entry is triggered when the price trades back below the breakout price of the pattern.
In this example, the false breakout short trade resulted in the price of the market declining and going much lower as the breakout traders are stopped out.
Example Stop-Loss Placement With The False Breakout Trading Strategy

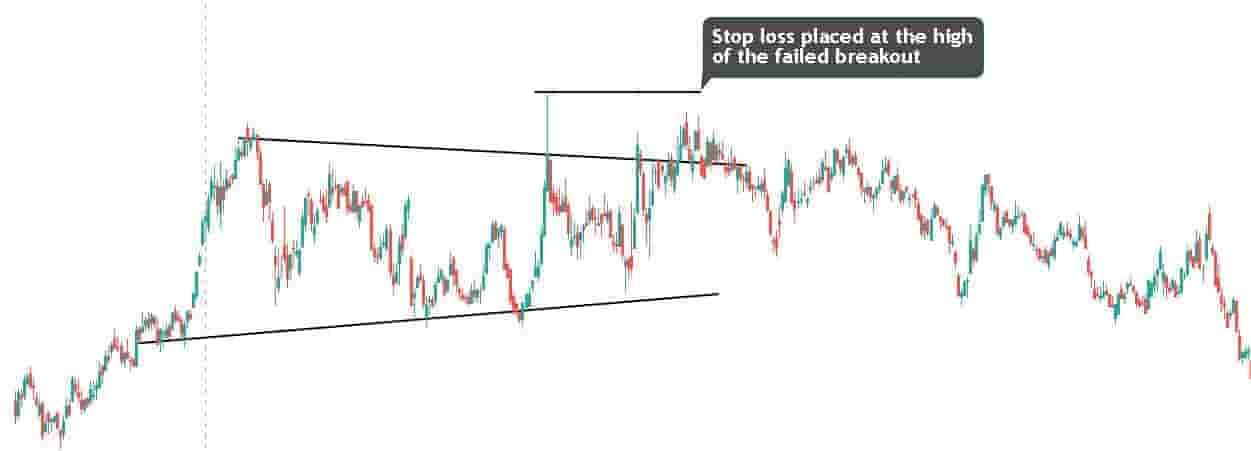
In the above price chart, there is an example of where to place stop-losses when trading the false breakout strategy.
A stop loss should be placed at the swing high of a failed breakout of a bullish chart pattern or the swing low of a failed break down from the bearish chart pattern.
In the price chart above, a stop-loss order is placed at the swing high level, as annotated on the chart.
Example Price Target With The False Breakout Trading Strategy

In the above price chart, there is an example of setting price targets when using the false breakout strategy.
A price target should be set at a nearby major level of support or a major level of resistance.
In the above chart example, the price clearly bounced off the support level making it an ideal price target for a short trade.
False Breakout Trading Strategy Timeframes
The false breakout trading strategy can be applied to any timeframe. However, newer traders tend to find the higher timeframe charts easier to learn.
The timeframes used for the false breakout trading strategy are:
- 1-minute to 5-minute price charts: This is for day traders and scalpers trading the false breakout trading strategy on lower timeframes.
- 30-minute to hourly price charts: This is for intraday traders that prefer to hold a trading position for a few hours at most.
- Daily price charts: This is for the swing traders that prefer to hold a trading position for a few days to a few weeks.
- Weekly price charts: This is for the longer-term traders that prefer to hold a trading position for weeks to a few months.
These are the most common timeframes used to trade the false breakout trading strategy.
False Breakout Trading Strategy Risks
There are a number of risks with the false breakout trading strategy that a trader should be aware of.
The risks with the false breakout trading strategy are:
- False breakouts can have choppy and volatile price action, especially during price consolidation periods in the market.
- Entry points are subjective which means that one trader could draw a chart pattern entry point completely different to another. This can cause newer traders to think they see a false breakout when in fact the chart pattern is drawn incorrectly.
These are the main risks with the failed breakout trading strategy to be aware of.
Conclusion
A trader should practice using the false breakout trading strategy on a demo account.
This ensures they can practice applying the strategy without risking real money.
Using a demo account will help a trader to practice buying, shorting, setting price targets and placing stop-losses when using the false breakout strategy.
After practicing on the demo account for some time, it might be then something a trader may attempt to trade with real capital.
This will depend on each individuals trader's own wishes and beliefs.
