What Is A False Breakout?
A false breakout, also known as a "failed breakout", is when the price of a financial market breaks out of a chart pattern or through a support or resistance level and fails to continue in the same direction.
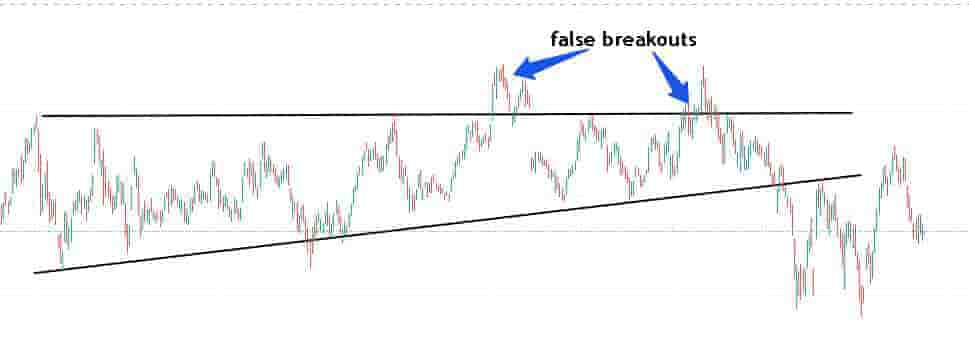
For example, if a resistance level is at $50 and the price of the market breaks out to $52 before failing and retracing back under $50, this is a failed breakout as the price of the market could not stay above the $50 breakout price level.
How Does A False Breakout Work?
A false breakout occurs when the price of a financial market breaks out of a predefined level like a support or resistance level or chart patterns like bull and bears and then fails to continue in the direction of the breakout.
During the breakout phase of a false breakout, there is no conviction and no follow-through momentum in the price action of a financial market at a breakout level.
Typically, the price of a market will trade through a breakout level on little to no volume which signals there are weak hands and no momentum to push the price higher or lower.
Then after the price pushes through the breakout level, the price action stalls and retraces back to the original breakout point.
A failed breakout can occur in rising trend price breakouts and down-trending price breakouts.
A false breakout most commonly occurs in price consolidation periods or volatile and choppy market environments.
Types Of False Breakouts
There are two types of false breakouts. The two types of false breakouts are:
- Bullish false breakout: A bullish false breakout is when the price of a market breaks out of a resistance level or chart pattern to the upside. The price initially moves higher before it fails at the higher prices and it then retraces back below the breakout level.
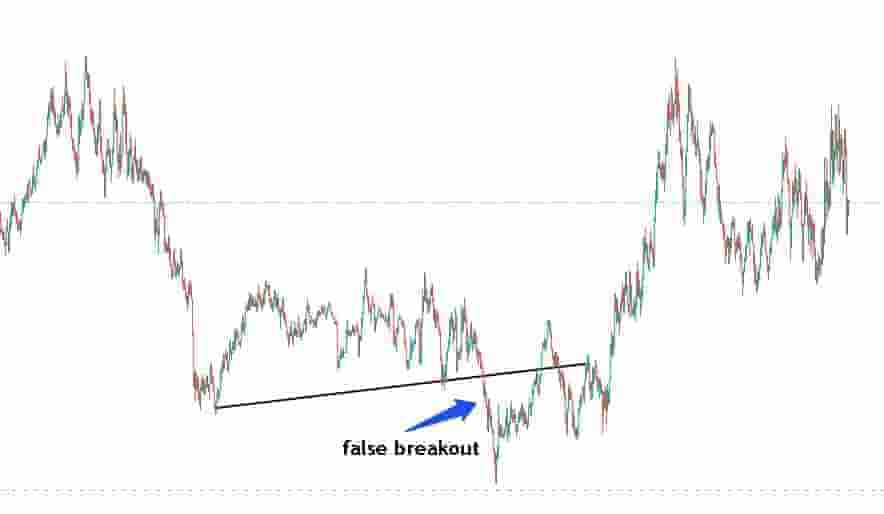
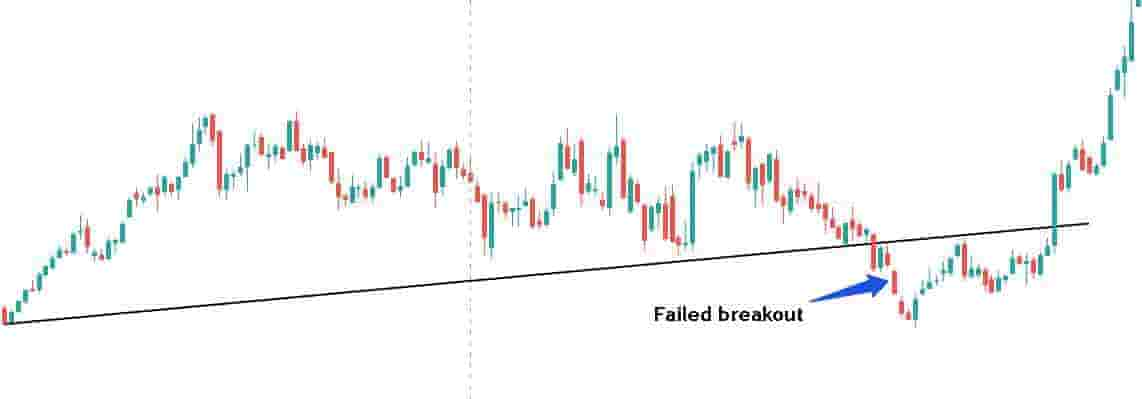
- Bearish false breakout: A bearish false breakout is when the price of a market breaks out below a support level or chart pattern. The price initially moves lower before it fails at the lower prices. The price bounces at the lower prices and trades higher back above the breakout level.
A false breakout occurs both on bullish price charts and bearish price charts.
Examples Of False Breakouts
Below are various examples of false breakouts in different markets from stocks to forex.
These examples are illustrated on different timeframe price charts.
Example Of A Bullish False Breakout

In the above price chart of Amazon stock, there is a false breakout when the price of Amazon breaks out of the ascending triangle chart pattern and then retraces back.
From the chart, the price fails to push higher and instead drops back below the breakout price level.
This is an example of a bullish false breakout in the stock market.
Example Of A Bearish False Breakout

In the above price chart of Tesla stock, there is a false breakout illustrated.
The price of Tesla stock breaks down below the rising support level and can not stay below the breakdown price level.
It bounces and pushes back above the breakdown price.
This is an example of a bearish false breakout in the stock market.
Example Of A False Breakout On A Shorter Timeframe Chart

In the above short-term 1-minute price chart of GBP/USD, there is a false breakout.
The price breaks down below the support level and struggles to continue in the direction of the breakout.
It bounces back to the entry price and continues higher. This is an example of a false breakout on a shorter-term price chart.
Example Of A False Breakout On A Longer Timeframe Chart

In the above price chart of the EUR/USD currency, there is a clear example of a false breakout on a longer-term weekly price chart.
The price of the currency breaks down below the rising support level and stalls for a few weeks before it retests the breakdown entry point and trends higher.
This is an example of a false breakout on a longer-term price chart.
How To Find False Breakouts
Some traders use a false breakout strategy to trade the markets. These traders have specific methods for finding false breakouts in the market.
To find false breakouts in financial markets:
- Scan the markets for chart patterns: Scan through the markets looking for chart patterns and/or support and resistance levels.
- Wait for the price to reach a specific level: Wait for the price of the market to reach the breakout point of the chart pattern or the support/resistance level.
- Examine the price action as it breaks out: Watch how the price of the market reacts at the breakout level. See if it is sluggish, volatile or choppy as it breaks out.
- Wait to see if it retests the breakout level: Watch to see does the price retest the breakout level after it breaks out. If the price fails to stay above or below the breakout level, this is a clue that it could be a failed breakout.
These are the steps for finding false breakouts in any capital market.
Differences Between A False Breakout & A Price Retest
The differences between a false breakout and a price retest are:
- A false breakout breaks out and comes back to the breakout point and continues to fail whereas a price retest is when the price breaks out and retests the breakout point and continues in the direction of the breakout.
- A false breakout has choppy and volatile price action whereas a price retest tends to be orderly with more structure.
- A false breakout will fail at the breakout entry price relatively quickly whereas a price retest will test the entry price and bounce off it or retrace of it quickly.
These are the main differences between a false breakout and a price retest.
A price retest means the price is simply retesting the breakout point and will continue in the direction of the breakout i.e. it is not a failed breakout.
