Technical analysis can help a trader set price targets on their short and long trading positions.
Calculating the target price of a trade by using technical analysis can be done in a number of different ways.
To set the price target for trades by using technical analysis:
- Find areas of support or resistance:Use technical analysis areas of support and resistance as price targets for trades.
- Use technical indicators extreme readings as targets: Use readings of extremely overbought or extremely oversold on oscillator indicators as price targets for trades.
- Use Fibonacci extensions for setting targets: Use the technical analysis Fibonacci extension levels as price targets for trades.
- Use chart patterns to set price targets: Use technical analysis chart patterns to set the price targets for trades.
These are the most common technical analysis techniques for setting price targets on trades.
They can be applied to both long trades and short trades.
Find Areas Of Support Or Resistance For Price Target Areas
Traders and technical analysts use major areas of support or resistance for areas to set their price targets on trades.
Typically, a resistance or support level will see the price of a market stall and potentially reverse.
This makes it useful to set price targets based on the major levels of support or resistance in a financial market.
Example Of Setting A Support Level As A Price Target
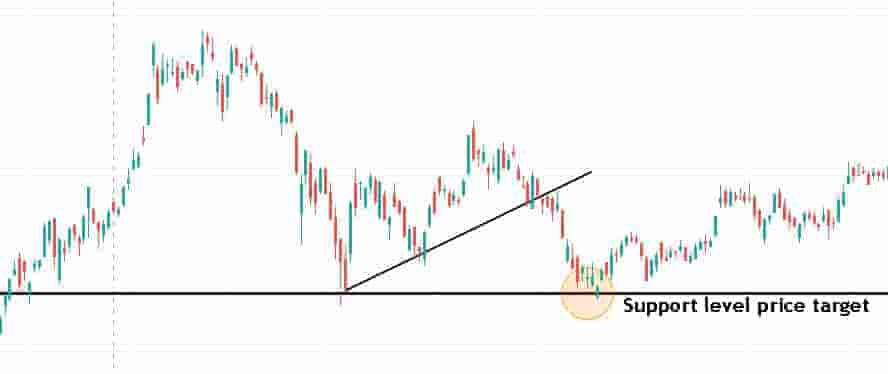
In the above price chart, there is an example of using a major level of support as a target price for a short trade.
In this example, the price bounced off the support level making it an ideal location for setting the target for a short trade.
A major support level can be identified by connecting two or more significant price swing lows levels together.
A bearish trend will struggle to continue below the support level meaning the support level is an ideal price to take profits and set price targets on short trades.
Example Of Setting A Resistance Level As A Price Target
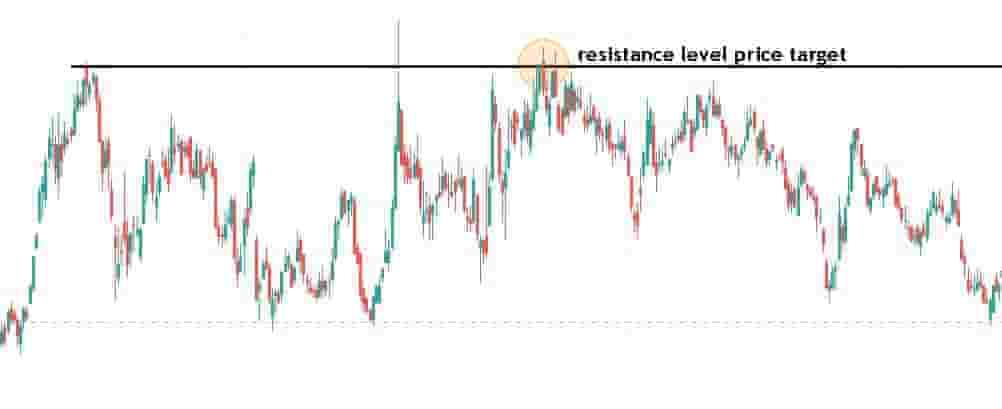
In the above price chart, there is an example of using a major resistance level as a price target for a long trade.
The price of the market trades up to the resistance level before reversing.
A major resistance level is identified by connecting two or more swing high levels together.
A bullish trend will struggle to continue through the resistance level meaning the resistance level is the ideal price to take profits or set price targets on buy trades.
Use Technical Analysis Indicators Extreme Readings As Price Targets
Another method of using technical analysis to set price targets is by using technical trading indicators and waiting for them to reach extreme levels.
When a technical indicator signals an extreme reading of overbought or oversold, it can be a signal to take profits on a long or short trade.
Traders use the extreme readings as price targets for their trades. When a reading is showing extreme overbought price action, it can be an indication to take profits on any bullish long trades.
When the indicator is showing an extreme reading of oversold, it can be an indication to take profits on short trades.
Example Of Using Overbought Technical Indicator To Set Price Targets On Long Trades
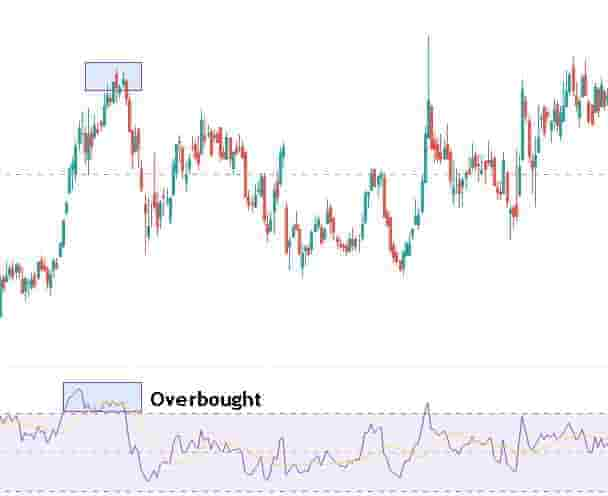
In the above price chart, the price of the market trended in a bullish direction before the relative strength index signaled that the market had entered an overbought phase.
This overbought phase is an ideal time to take profits and set price targets as the bullish trend may experience some price retracement during this period.
Example Of Using An Oversold Technical Indicator To Set Price Targets On Short Trades
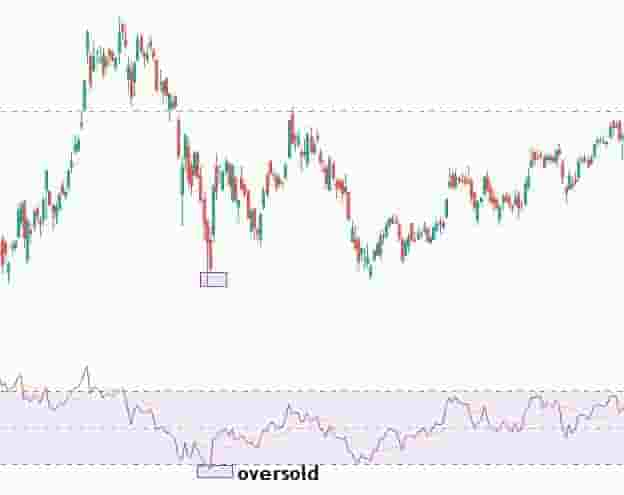
In the above price chart, the price of the market trended in a bearish direction before the relative strength index signaled that the market had entered an oversold phase.
This oversold phase is an ideal time to take profits and set price targets on a short trade as the bearish trend may experience some price bouncing during this period of the price action.
Use Fibonacci Extensions For Setting Price Targets
Another method for setting price targets on trades is by using the Fibonacci extension indicator.
This technical analysis tool is used by traders to spot potential areas of support and resistance levels in a market and set price targets for long and short trades.
Common Fibonacci extension levels used as price targets are the 161.8% level and the 261.8% level.
Example Of Using The Fibonacci Extension For Setting Price Targets On Long Trades
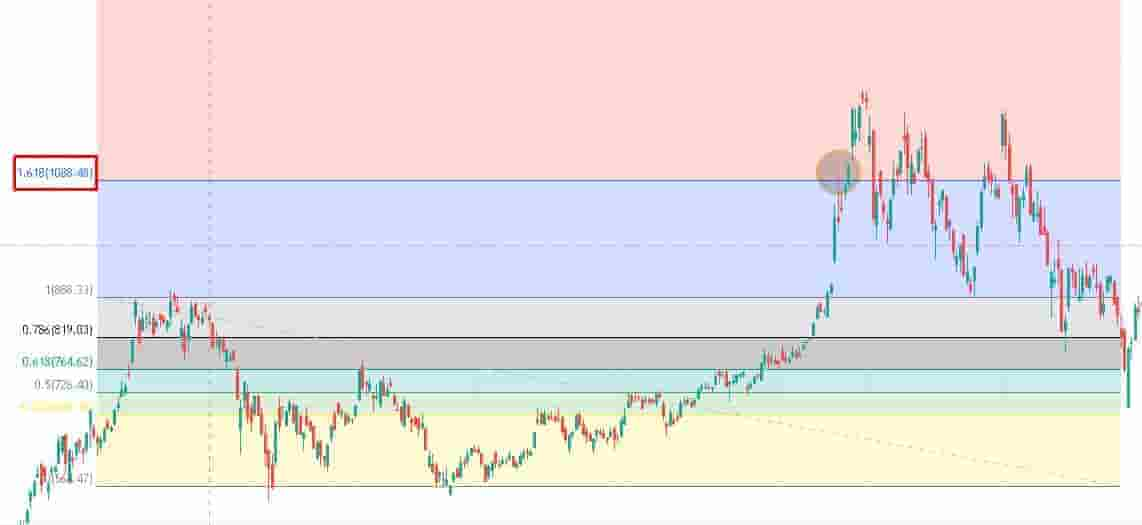
In the above price chart, the market trends higher until it reaches the 161.8% Fibonacci extension level where the price stalls and starts to consolidate around that area.
The 161.8% extension level is an area that traders can use to set price targets for trades for long trades.
Traders can expect to see some type of resistance at these extension levels, making them an ideal spot for taking profits and setting targets on bullish trades.
Example Of Using The Fibonacci Extension For Setting Price Targets On Short Trades
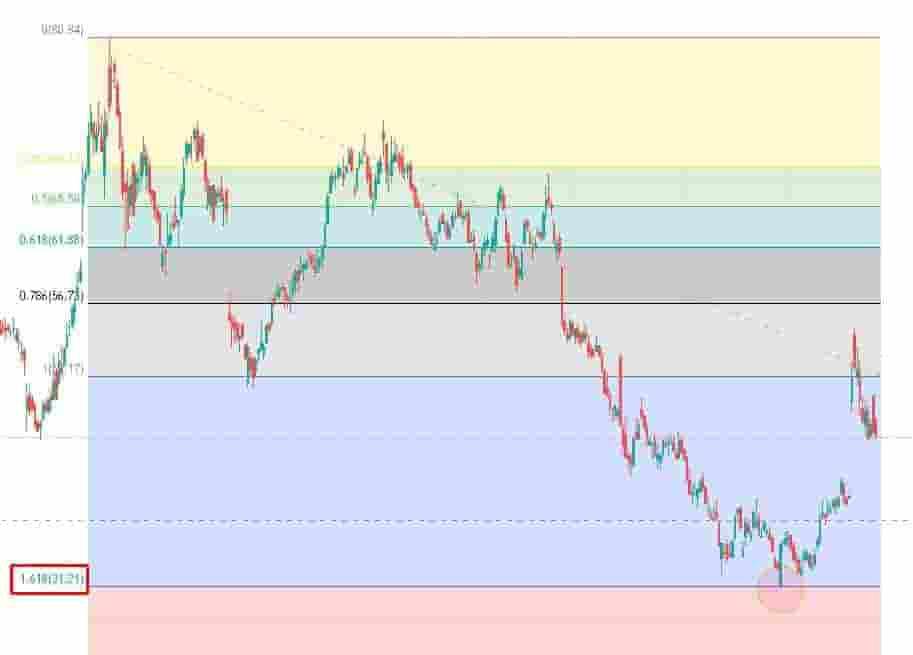
In the above price chart, the market trends lower until it reaches the 161.8% Fibonacci extension level where it bounces off it, almost perfectly.
The extension level is an area that traders can use to set price targets for trades.
In this example, setting a price target for the short trade at the 161.8% level proved to be ideal.
Use Technical Analysis Chart Patterns To Set Price Targets
Traders can use price chart patterns to help them set price targets in a financial market.
To use technical analysis chart patterns to set price targets:
- Identify the chart pattern on a price chart
- Measure the height of the chart pattern
- Add the height to the breakout level or subtract the height from the breakdown level to get the price target
Following those steps will help find easy-to-use price targets based on the chart patterns.
Example Of Using A Chart Pattern To Set Price Targets
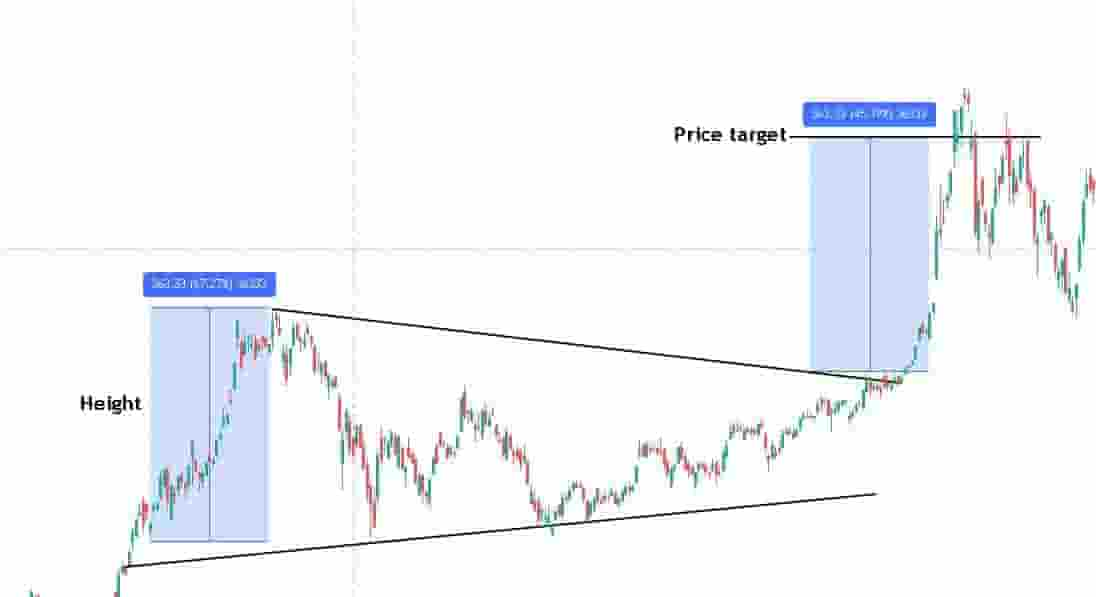
In the above price chart of Tesla stock, a symmetrical triangle pattern forms.
The height is marked on the left and it is the difference between the swing high and the swing low.
In this case, the height is $363.33.
When the price of Tesla stock breaks out of the chart pattern, we add the $363.33 to the breakout price to get the price target level (the blue area on the righthand side of the price chart).
Summary
Technical analysis can help a trader find the ideal price targets for their long and short trades.
Technical indicators, chart patterns and basic support and resistance levels are the most common methods for setting price targets for trades.
When a trader is starting out, the most beginner-friendly way to set targets is by simply marking the support and resistance levels and using them at price targets.
When a trader gets more experienced in technical analysis, they can practice using Fibonacci extensions and chart patterns for setting price targets for trades.
