What Is A Reversal Pattern?
A reversal chart pattern is a technical analysis chart pattern that forms on the price charts of financial markets. It signals that the price action in a financial market is going to reverse from one trend direction to another.
Reversal patterns form at the end stage of a price trend and typically signal that a new trend in the opposite direction is beginning.
For example, if the price of a financial market is trending in a bearish direction, a reversal chart pattern will signal that the bearish trend is about to end and that a new bullish trend is about to begin.
Types Of Reversal Chart Patterns
There are many different types of reversal chart patterns found in technical analysis.
Types of reversal patterns include:
- Head & shoulders: Head and shoulders patterns are bearish price reversal chart patterns that are shaped like a head with shoulders on a price chart.
- Inverse head & shoulders: An inverse head and shoulders is a bullish price reversal chart pattern that is shaped like a head with shoulders turned upside down.
- Wedges: These can be rising wedges or falling wedges and can signal a potential price reversal is imminent.
- Triple Tops: Triple tops are resistance levels with 3 clearly defined swing highs that signal a bearish price reversal.
- Triple Bottoms: Triple bottoms are support levels with 3 clearly defined swing lows that signal a bullish price reversal.
- Diamond Pattern: A diamond chart pattern is a pattern shaped like a diamond that can be a bullish or bearish price reversal signal.
Reversal Patterns Examples
Below are visual examples of reversal chart patterns.
Example Of A Head & Shoulder Reversal Pattern
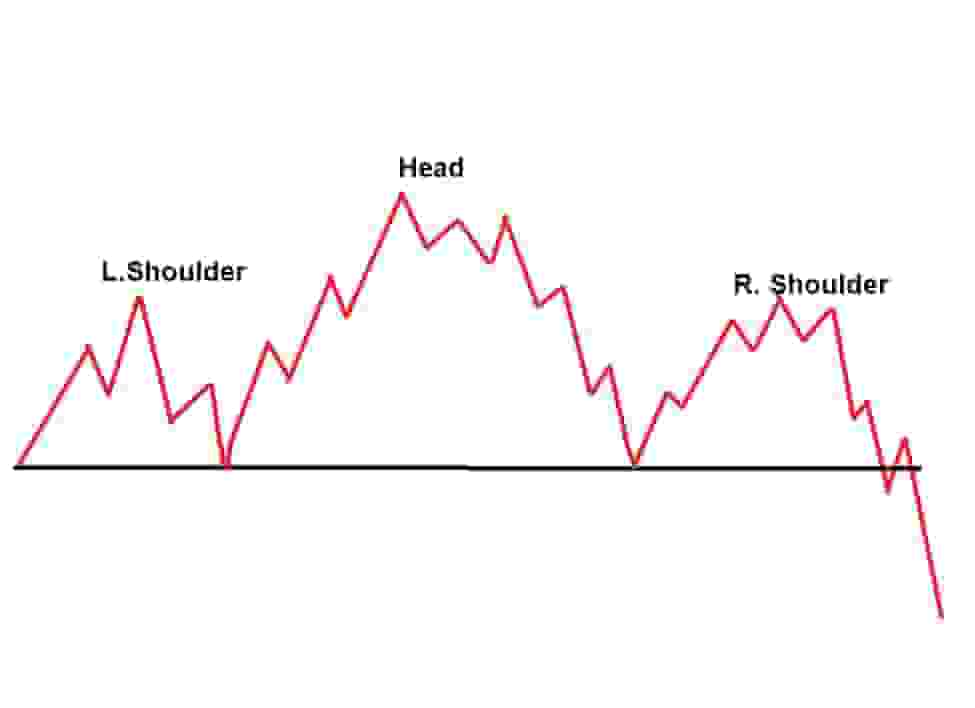
A head and shoulders reversal chart patterns form at the end of a bullish price trend in a financial market
It signals that the bullish price trend is about to finish and that a price reversal will occur from bullish to bearish.
A head and shoulders pattern resembles a "head" with a "left shoulder" and a "right shoulder".
There is a support line called the "neckline" and this is where the short trigger is for traders that wish to trade this pattern.
Example Of An Inverse Head & Shoulders Reversal Pattern
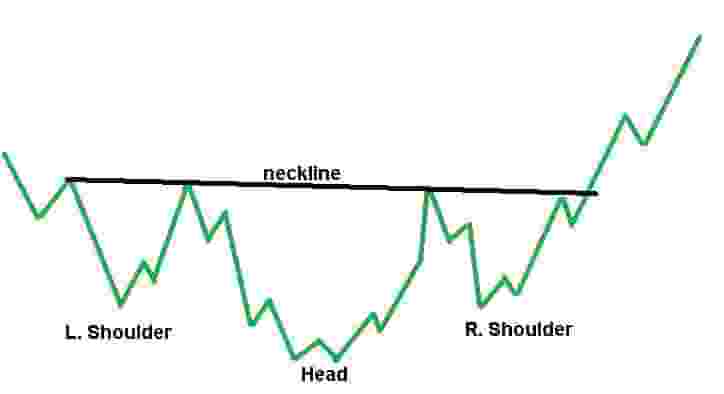
An inverse head and shoulders is a reversal chart pattern that forms at the end of a bearish price trend.
It signals that the bearish price trend is about to finish and that a price reversal will occur with market conditions changing from bearish to bullish.
It resembles an upside-down head with shoulders and a resistance level known as the "neckline".
When the price breaks out above this neckline, a buy trigger is alerted where traders buy.
Example Of Wedge Reversal Patterns
Below are visual examples of wedge chart patterns.
Falling Wedge Example
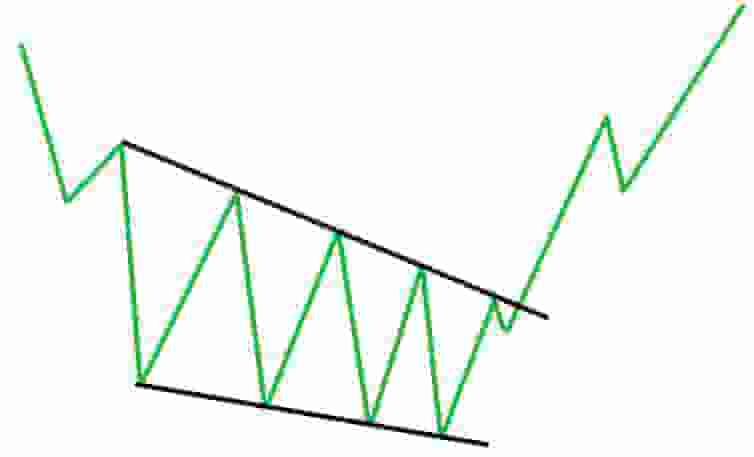
A falling wedge reversal pattern forms at the end of a bearish price trend in a financial market.
It signals that the bearish trend could finish soon and the price may reverse to a bullish price trend.
A falling wedge is displayed by drawing two lines, a declining resistance line connecting the lower swing highs together and a declining but tightening support line that connects the lower swing lows together.
When the price of a capital market breaks out above the declining resistance level, this is the entry trigger to buy.
Rising Wedge Example
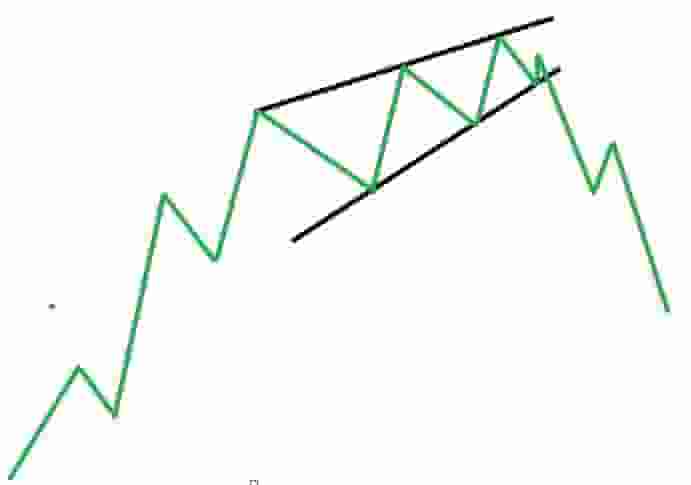
A rising wedge reversal pattern forms at the end of a bullish price trend in the financial markets.
It signals that the price of the market may reverse from bullish price action to bearish price action and the prices may decline.
A rising wedge reversal pattern is displayed by drawing two lines, a rising resistance level connecting the higher swing highs together and a rising support line connecting the higher swing lows together.
A short entry is triggered when the price of the financial market breaks down below the rising support line of the pattern.
Example Of A Triple Top Reversal Pattern
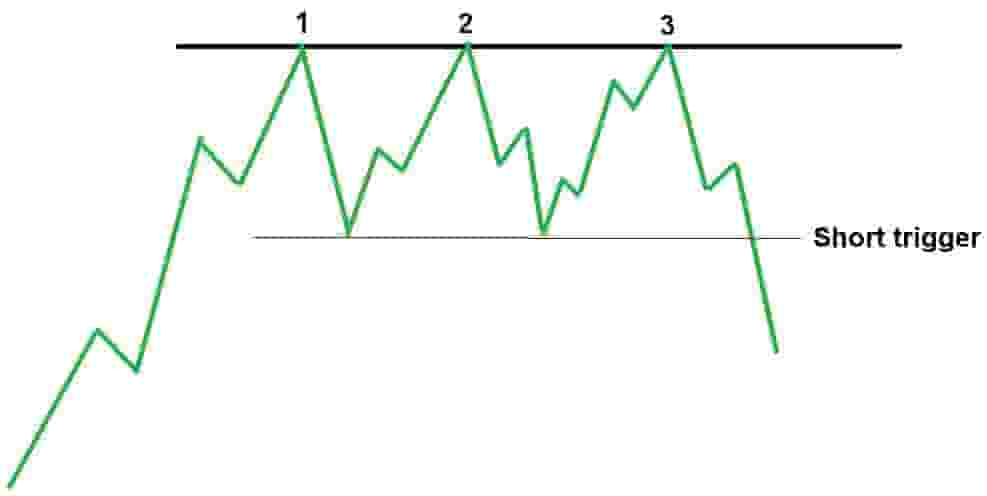
A triple top reversal pattern forms at the end of a bullish price trend in the markets.
It signals that the price may reverse from a bullish trend to a bearish trend.
A triple top is displayed by connecting 3 swing highs together with a horizontal resistance line.
A short entry is triggered when the price breaks down below the previous swing low.
Example Of A Triple Bottom Reversal Pattern
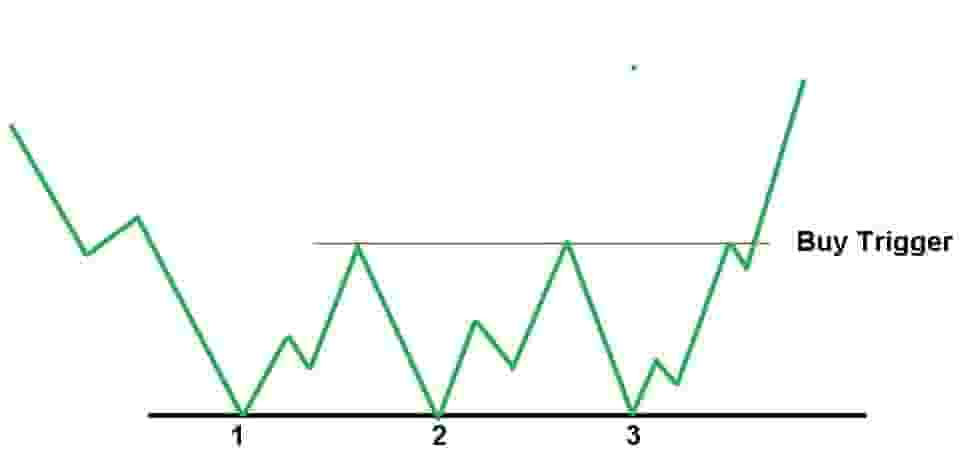
A triple bottom reversal pattern is a chart pattern that can form at the end of a bearish price trend in the markets.
It signals that the price of a market may switch from a bearish trend to a bullish trend.
A triple bottom is displayed by connecting 3 swing lows together with a horizontal support line.
When the price breaks out above a swing high just above the triple bottom, a buy alert is triggered.
How To Trade Reversal Patterns
Reversal chart patterns are relatively easy to understand and trade.
To trade reversal patterns:
- Find reversal patterns on price charts: Browse through the various markets and look for reversal patterns that are forming in them.
- Enter if the price reaches an entry price: Enter a trade when the price either breaks out or breaks down from the chart pattern (depends on if it's a bullish or bearish reversal pattern).
- Set stop-losses: Stop-losses should be placed at a nearby swing low or nearby swing high, depending on if it's a buy trade or short trade.
- Set price targets: Price targets are typically set at 3 times risk or more or at a clearly defined level on a price chart.
These are the simple steps to follow when trading reversal chart patterns.
Reversal Pattern Timeframes
Reversal chart patterns can form on any timeframe of price charts.
For example, day traders use shorter 1-minute to 5-minute timeframe price charts to find these patterns.
Swing traders use daily to weekly timeframe price charts to find these reversal patterns.
Longer-term traders use weekly to monthly timeframe price charts to find these chart patterns.
However, even tick charts or different variations of timeframes can show these reversal patterns in any market.
Reversal Patterns Benefits
The benefits of reversal chart patterns are:
- They help traders take profits on trades: A reversal pattern can help identify that it's time to take profits, especially for trend following traders.
- They provide clarity to the price action: Reversal patterns can help provide logic and make the price action much more clear for traders.
- They can lead to capturing large moves: A reversal pattern that breaks out or breaks down can lead to large price moves.
- They are easy to learn: Reversal chart patterns are relatively easy for beginner traders and new technical analysts to learn.
- They provide a great reward to risk ratio: Due to some of the large price moves that result from these patterns, it offers traders very good risk to reward ratios, typically a minimum of risking $1 to make $3.
These benefits make reversal patterns a useful tool in a trader's technical analysis toolkit.
Reversal Patterns Limitations
The limitations of reversal chart patterns include:
- They have a high fail rate: Reversal chart patterns have a high fail rate of 50 - 70%. This will be too high for a trader with a poor risk-reward ratio.
- They are less reliable in choppy market conditions: When the market price action gets volatile and trades sideways, these patterns can become even less reliable with many false breakouts.
Every trader should consider and be aware of these drawbacks before applying reversal patterns to their trading strategy.
