Technical analysis can help a trader find many shorting or “short selling” opportunities in various financial markets.
Knowing how to apply technical analysis to find these short setups takes some time to learn.
To find shorting opportunities by using technical analysis:
- Look for technical indicators at extreme overbought levels
- Look for prices of financial markets breaking support levels
- Check price charts where markets are near resistance levels
- Check for bearish chart patterns forming on price charts
- Look for bearish technical divergence between markets
These technical analysis methods for finding shorting opportunities can be applied to any market including stocks, bonds, futures, options, forex, cryptocurrencies and commodities.
Look For Technical Analysis Indicators At Extreme Overbought Levels
The first method of using technical analysis to find shorting opportunities is by looking for technical indicators showing extreme overbought readings in financial markets.
Technical analysis indicators for finding overbought levels and helping to find shorting signals include:
- Relative Strength Index (RSI)
- Bollinger Bands
- Stochastics
- MACD
These technical trading indicators can signal the beginning of a price decline and panic selling in a market.
Example Of The RSI Indicator Signaling A Short Setup
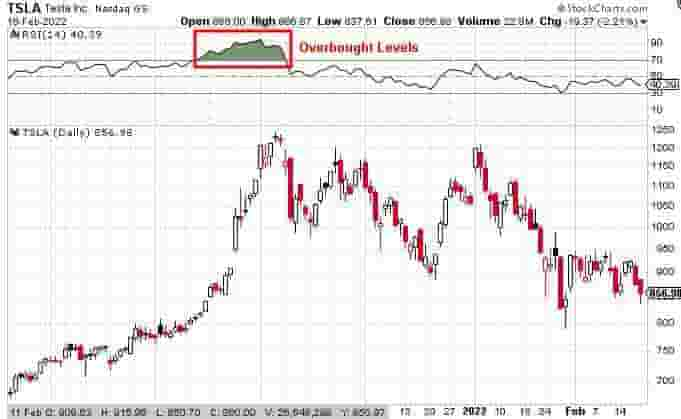
In the above price chart of Tesla stock (TSLA), there is an example of the RSI technical indicator signaling a shorting opportunity (as annotated in the red rectangle on the price chart).
Once the RSI indicator level moves above the 70 line, it indicates that the market is in overbought conditions and that a price selloff might be imminent.
It is not a guarantee that the price will decline once it reaches above the 70 level on the RSI but it should alert a trader that a potential decline may occur soon.
Example Of Bollinger Bands Signaling A Short Setup
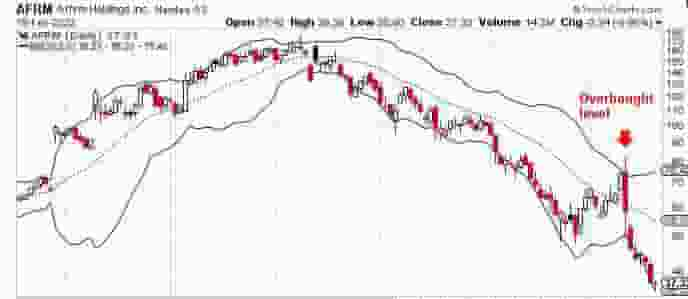
In the above price chart of Affirm Holdings (AFRM), there is an overbought level at the upper band of the bollinger bands.
Using the upper band of the bollinger bands as an overbought level works best when the price of the market is already in a downtrend as evident from the example price chart above.
Using bollinger bands with other technical indicators can offer many higher probability shorting setups in various financial markets.
Example Of Stochastics Signaling A Short Setup
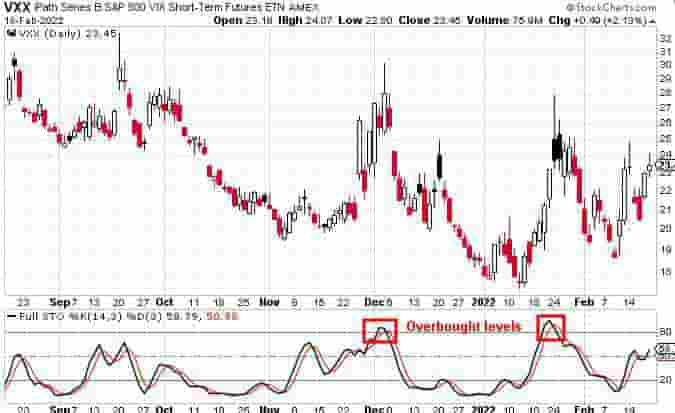
In the price chart above of the VIX (VXX), the stochastics indicator signals multiple shorting opportunities when the stochastics gets above the 80 line which represents overbought conditions.
As evident from the price chart, the stochastics indicator proved a useful indicator in this VXX market.
Ideally, using the stochastics indicator with other technical analysis tools like resistance levels or chart patterns could be effective in finding higher probability short setups.
Example Of MACD Signaling A Short Setup
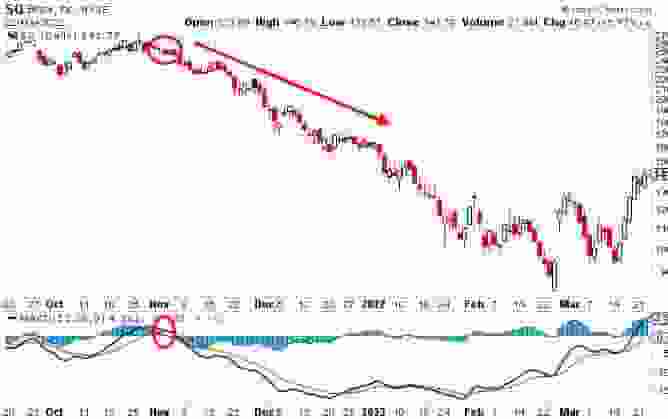
In the example above, the MACD technical indicator signals a shorting setup when the shorter MACD line crosses below the longer term MACD line.
In this example, it signaled a long and steep price decline over the next few months, making for an excellent short trade.
Using the MACD when prices trade into key resistance levels can be a powerful tool in a traders technical analysis toolkit to help spot higher probability short setups.
Look For Prices Of Financial Markets Breaking Support Levels
Another way of using technical analysis to find shorting opportunities in capital markets is by looking for markets where the price is breaking a key support level.
Prices breaking a key support level can be a sign of weakness in a market and it can signal an imminent sharp decline in price over the coming days or weeks.
As a note, a dominant support level will have two or more bounces off that level before it breaks through it.
A support level can form as a horizontal line or a rising support level.
Example Of Using A Break Of A Support Level As A Short Trigger In The Stock Market
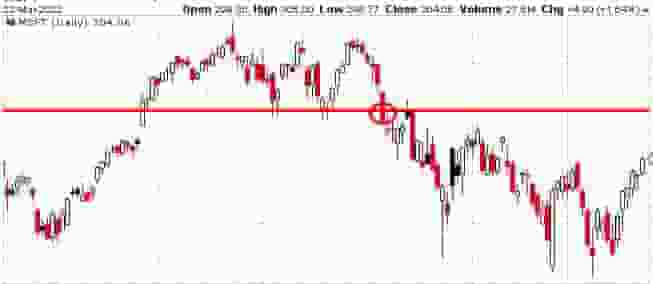
In the above example of the price chart of MSFT, the price breaks through the support level (marked in the red circle).
When price breaks through the support level, it signaled a large move to the downside over the coming weeks.
Example Of Using A Break Of A Support Level As A Short Trigger In The Forex Market
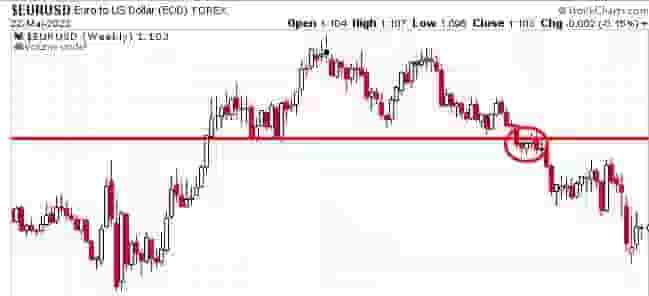
In the price chart above of the EUR/USD currency pair, the price breaks support (marked in red circle) and continues lower over the coming weeks.
The support level was tested two times in the past before it finally had its price decline after breaking the horizontal level.
These support levels price breaks can be a great technical analysis shorting trigger and it can signal the beginning of a new downtrend.
Check price charts where markets are near resistance levels
Another method of using technical analysis to find short setups is to browse the price charts of financial markets to find price charts that are near a big resistance level.
Essentially, a resistance level is a price level on a chart where price struggles to go higher.
These resistance levels can signal a reversal of a bullish trend and signal the beginning of a new bearish price trend.
As a note, a resistance level is more important when price previously reacted off the level more than two times in the past.
A resistance level can form as a horizontal line or a declining or downtrending level.
Example Of A Short Trigger At A Resistance Level In Stocks
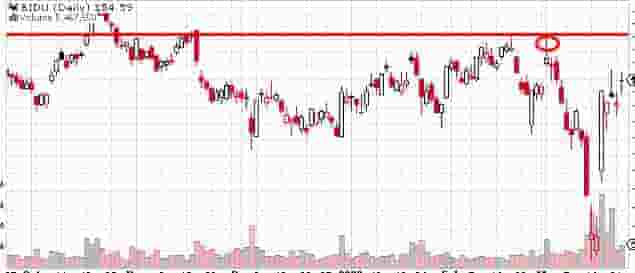
In the above price chart example, there is a clear horizontal resistance level (marked in red).
Price traded lower from this level on two other occasions and the short trigger occurred when it traded into the price level the third time (marked in red circle).
This is an example of using technical analysis to find horizontal resistance levels to short a stock.
Example Of A Short Trigger At A Downtrend Resistance Level
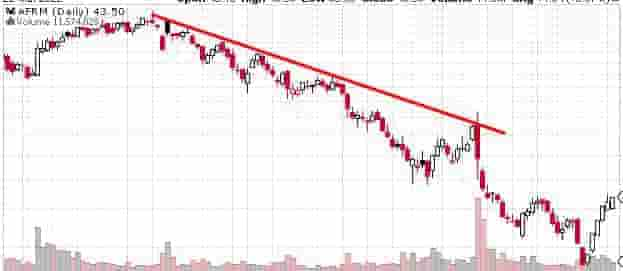
In the price chart example above, there is a clear and defined downtrend resistance level (marked in red).
As price trades up into this level, it immediately reverses and continues its downtrend.
This is a an area where a trader can enter a shorting position with a tight stop loss.
The more times the price reverses off a downtrend resistance level, the more important the level becomes.
Check For Bearish Chart Patterns Forming On Price Charts
A powerful way of using technical analysis to find shorting opportunities is by reading price charts and trying to find bearish chart patterns forming.
Bearish chart patterns that can trigger short setups in a financial market include:
These are some of the most popular price chart patterns that signal potential future bearish price action.
Example Of Bear Flags Triggering Short Setups
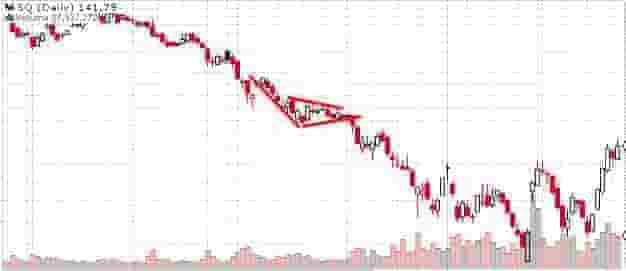
In the price chart above, a bear flag forms on the chart (annotated in red lines).
This is a bearish chart pattern that can signal a further price decline if price breaks out from the flag.
This chart patterns can be a very useful technical analysis tool to find short setups in the markets where they form.
Examples Of Head & Shoulders Creating Short Trade Setups In The Markets
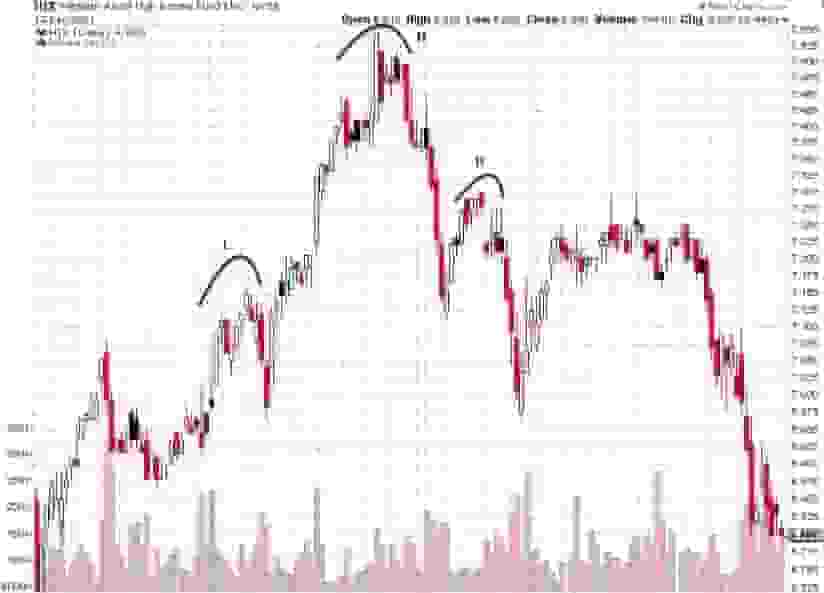
The head and shoulder pattern is a bearish technical analysis chart pattern that can signal that the price will go lower in the near future.
In the above price chart example, a head and shoulder pattern forms and price declines much lower over the next few weeks.
Finding these patterns in a market can be a useful way of applying technical analysis to short setups.
Examples Of Descending Triangle Patterns Signaling Short Trade Setups
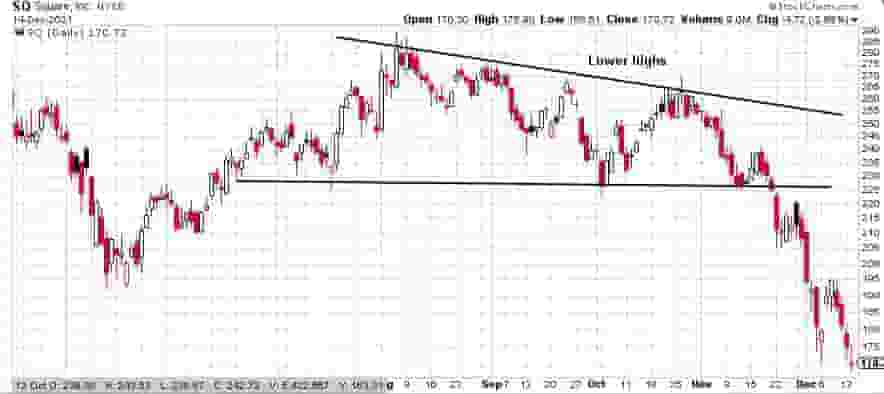
Descending triangle chart patterns are another technical analysis short setup that can form on the price charts of capital markets.
These patterns can signal a potential downtrend is imminent if the price breaks out from the chart pattern.
Technical analysts and traders routinely use these patterns to find shorting opportunities with low risk entries.
Look For Bearish Technical Divergence Between Markets
A bearish technical divergence is when two similar markets diverge in price.
An example of this would be if the price of AAPL stock made a lower low in price whereas the NASDAQ index did not simultaneously make a lower low in price also.
This would signal that AAPL stock is forming a technical divergence and is a “technically weak” stock relative to the overall market price action.
Example Of A Bearish Technical Divergence In The Markets
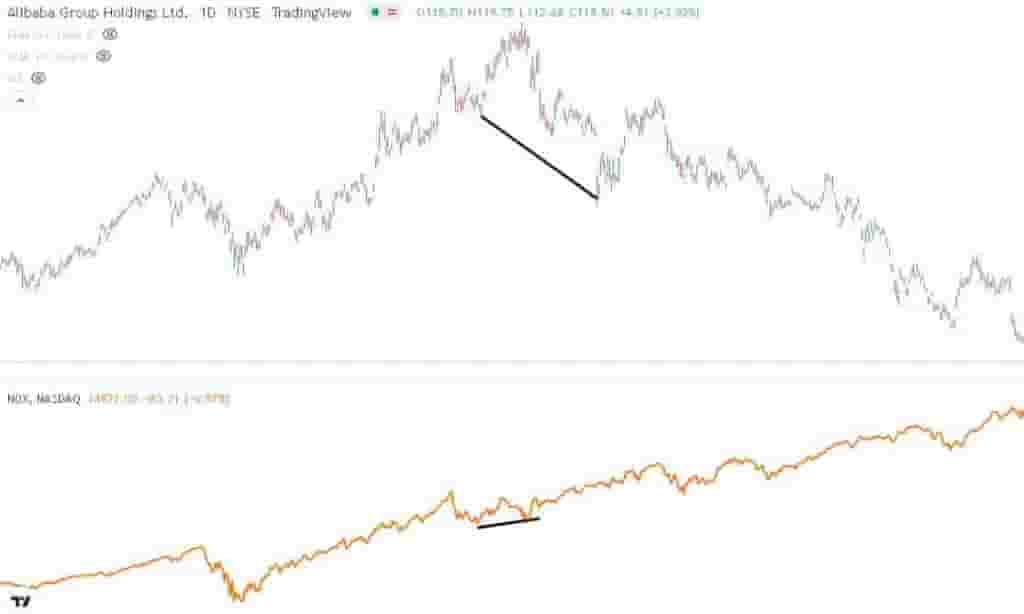
In the above price chart, we see a potential weak stock in Alibaba compared to the overall market of the NASDAQ.
As the NASDAQ makes higher lows (marked in the black rising support level) while BABA stock makes a lower low signals that this stock is potentially weak and a higher probability short setup is forming.
Watching for technical divergence can be great when used in conjunction with other technical analysis shorting triggers like a downtrend resistance setup or a technical indicator signaling overbought or price exhaustion.
Conclusion
There are many shorting signals created by technical analysis. Knowing how to filter them down to only trade the highest probability is what separates a beginner level trader and an advanced level trader.
Using a confluence of technical analysis factors combined can create higher probability shorting opportunities.
When starting out with using technical analysis for finding shorting signals. new traders should practice by using free technical analysis tools and a paper trading account to learn without risking real capital.
