Knowing where to place stop-loss orders when trading is important for any trading or investing strategy.
Placing stop-losses in the correct place can be hard to do, especially for new traders.
One solution for traders is to use technical analysis to help guide them in finding the best place to set their stop-losses.
To place stop-losses by using technical analysis:
- Use technical analysis indicators to help determine where to set stop-losses
- Use a price chart's support or resistance levels to determine a stop-loss placement area
These are the two ways technical analysis can be used to help with determining where to place stop-loss orders in a trade.
The stop-losses used in these methods are trailing stop-losses, stop market orders and stop-limit orders.
Generally, what type of stop-loss order is used is up to an individual trader's preferences.
Use Technical Analysis Indicators To Help Determine Where To Set Stop-Losses
The first method for using technical analysis to help determine where to set stop losses is by using technical indicators.
Technical indicators that can help with placing stop-loss orders include:
- Parabolic Sar
- Moving Averages
- Bollinger Bands
- Average True Range
These indicators offer the ability to set stop-loss orders, especially trailing stop-loss orders.
Parabolic Sar For Placing Stop-Losses
The Parabolic Sar is a technical indicator used to help determine the direction of a financial market.
However, this indicator can also be used as an indicator for where to place a trailing stop-loss order.
The indicator plots as dots above and below the price on a price chart.
In a bullish price trend, the parabolic sar dots will be rising and in a bearish trend, the parabolic sar dots will be declining.
Using these dots as a trailing stop-loss level can be helpful for placing stops and catching large trends.
Example Of Parabolic Sar For Stop-Loss Placement
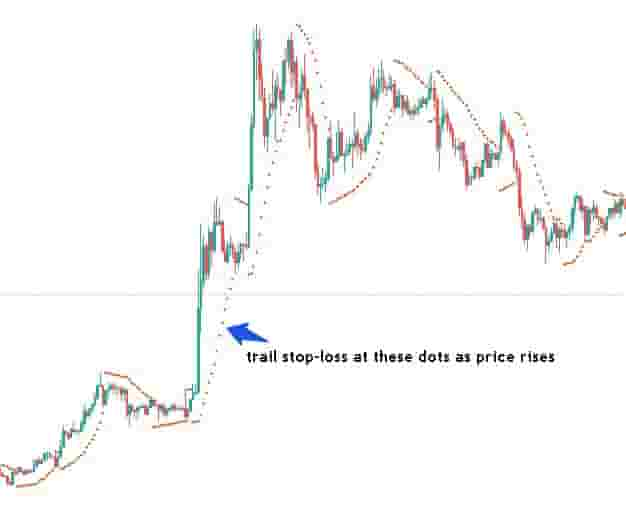
In the above price chart example, a trader can use the dots of the parabolic sar to trail a stop-loss as the price rises.
When the price eventually breaks the parabolic sar, the trailing stop-loss would take a trader out of the trade after capturing a large percentage of the bullish price action.
Moving Averages For Placing Stop-Losses
Another technical indicator to help determine where to place stop-losses is the moving average indicator.
The moving average is an overlay indicator that smooths out the trend of a market over a particular period of time.
In trending markets, prices trade above or below the moving averages.
The moving average level can be a great place to place stop-losses in bullish or bearish trending markets.
Example Of Using Moving Averages For Stop-Loss Placement Level
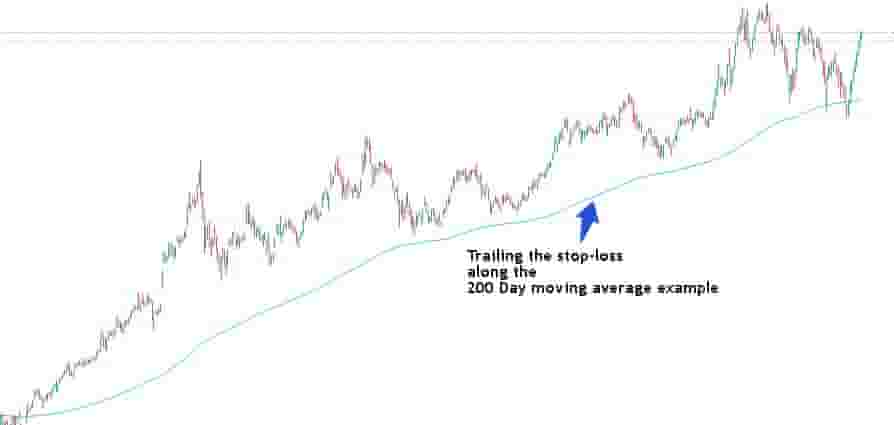
In the above price chart, a 200-day moving average is a great place to place a trailing stop-loss level in strong bullish price trends.
Trailing a stop-loss along the moving average level would help a trader catch a large move in the markets without taking profits too soon or stopping out due to short-term volatility.
Bollinger Bands For Placing Stop-Losses
Bollinger Bands are an overlay indicator that can plot the volatility and standard deviations of the volatility on a price chart in the form of 3 bands or lines.
Bollinger Bands can be useful for helping a trader determine where to place stop-loss orders when trading.
In uptrending/bullish markets, traders can use the lower band as a trailing stop-loss level.
In downtrending/bearish markets, traders can use the upper band as a trailing stop-loss level.
Example Of Using Bollinger Bands For Placing Stop-Losses
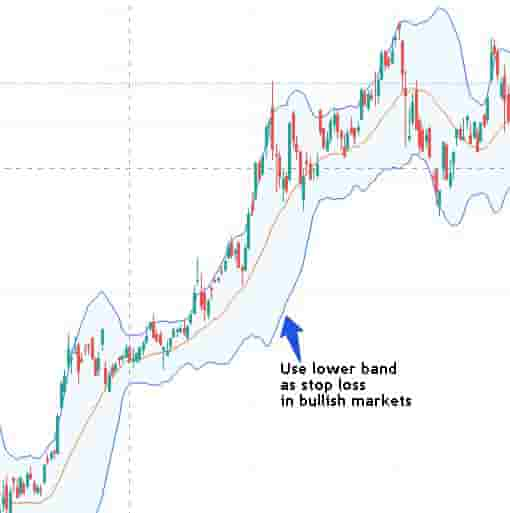
In the above price chart example, a lower band is a great place to set a trailing stop loss level.
Bollinger Bands work best for placing stop-losses in trending markets and can be quite choppy during sideways or consolidation price action.
Average True Range For Placing Stop-Losses
The Average True Range (ATR) is a technical indicator that measures the volatility in a financial market.
It offers the average range of price over a set period of time, typically 14 days.
The ATR indicator can help a trader set a stop-loss because it helps with placing stops below or above the average daily volatility within a market.
For example, if an ATR reading was $15, meaning the average movement of price in that market moves $15 up or down on an average day, a trader could use this information and place a stop $16 above or below their entry price so that volatility doesn't stop them out too early.
Example Of Using The Average True Range For Placing Stop-Losses
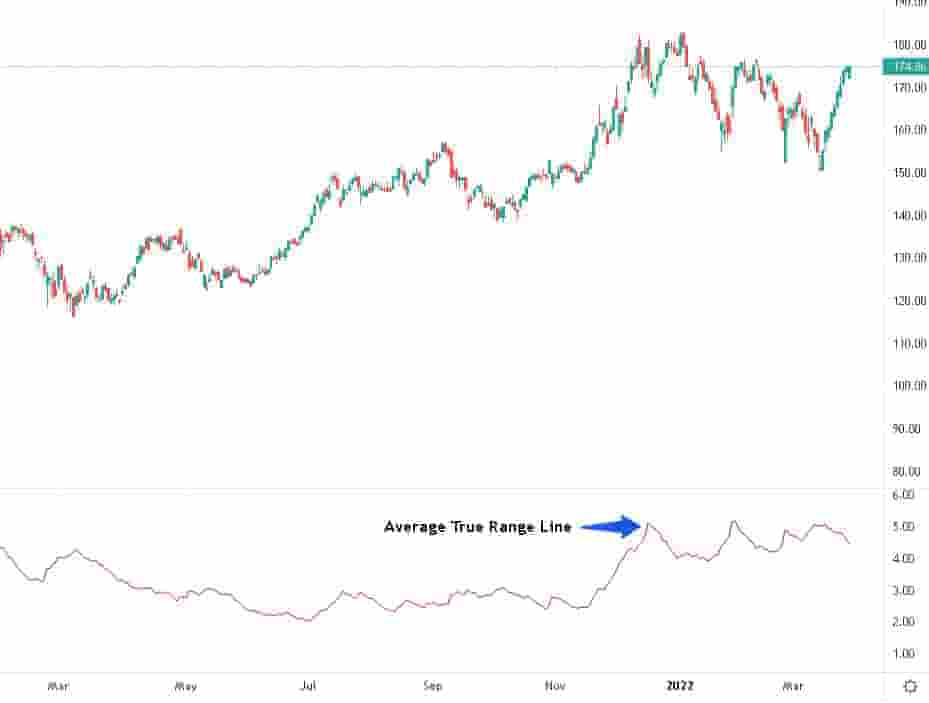
In the above price chart example, we can see the ATR level hovering around $5.
This means a trader could use this information to place a stop over $5 from their entry price to avoid volatility stopping them out prematurely.
Use A Price Chart's Support/ Resistance Levels To Determine A Stop-loss Placement Area
Another popular method of determining where to set stop losses by using technical analysis is to simply place the stop losses at major support or resistance levels.
Support and resistance levels mark major inflection points on a price chart and they can be a great place to place stop-losses.
Example Of Using Support Levels To Determine Stop-Loss Levels
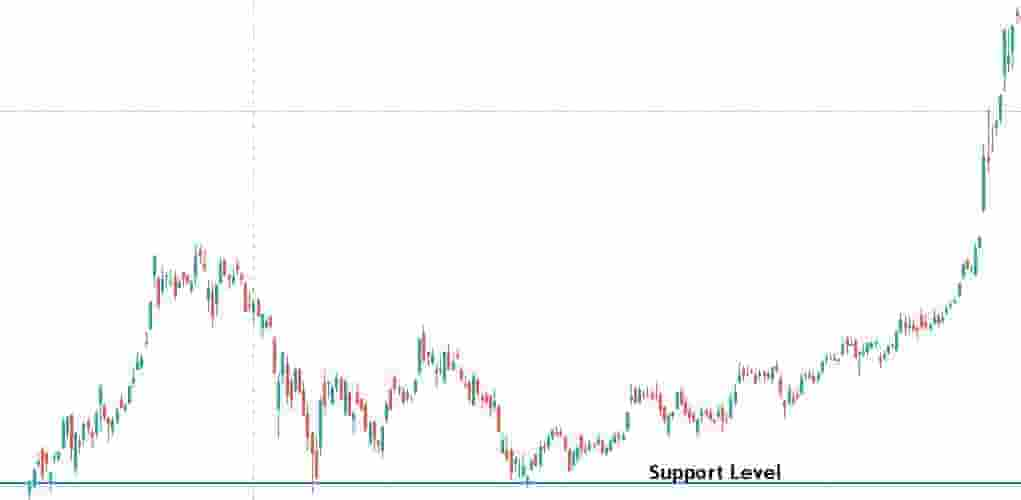
In the above price chart, a clear support level is a great place to set stop-losses.
Buying any breakouts or taking any type of bullish trade near that support level means placing a stop-loss just below it a great location to stop out if wrong on the trade.
Example Of Using Resistance Levels To Determine Stop-Loss Level
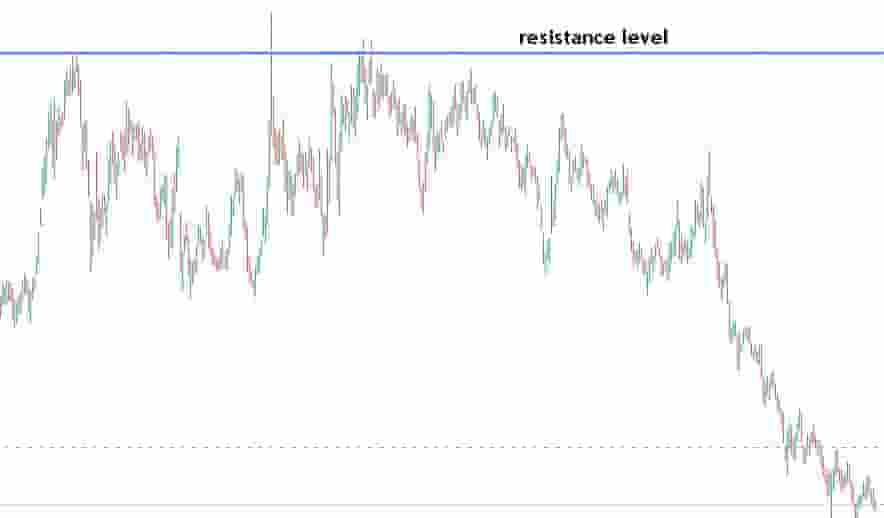
In the above price chart with a clear resistance level, a great place to place a stop-loss for shorting trades is just above this resistance level.
Clearly defined resistance levels make it easy to determine the risk and where to place stop losses and if the price does break through the resistance level, generally price will continue in that direction for some time.
Stopping out right above the resistance level means a trader won't get caught in a larger loss if the price continues to move against them.
Summary
Essentially, there are two main methods of determining where to place stop-losses by using technical analysis.
The two methods are using technical indicators or placing stops above resistance or below support levels.
The most popular method used for placing stop-losses by using technical analysis is placing stop-losses above/below major price support and resistance levels.
