Technical analysis based strategies can help a beginner trader find buying and selling signals in a market.
A technical analysis strategy seeks to predict future price movements by using technical analysis to examine historical price data.
A trader will use either chart patterns or technical indicators as part of a technical analysis strategy.
There are thousands of technical analysis type strategies used to trade markets and figuring out the right one to use can be difficult.
Technical analysis strategies for beginner traders to learn include:
- Moving Average Crossover Strategy
- Stop Loss Reclaim Support/Resistance Strategy
- 3 Touch Trendline Buy/Short Strategy
Applying these strategies does not guarantee any profit will be made and any trade or investment is taken at a trader’s own risk.
These technical strategies should be considered as a foundation for any new trader to build upon and improve.
As with all the trading strategies listed, a new trader should practice technical analysis on a demo account before ever trading with real money.
Moving Average Crossover Strategy
The moving average crossover strategy is a basic and beginner friendly technical trend following strategy.
The strategy uses the exponential moving averages technical indicator to help spot trend reversals and new trends forming.
This moving average crossover strategy can be used by day traders, swing traders and position traders.
It is applied to multiple timeframes from short term timeframes like 1 minute charts to monthly candlestick charts.
Moving Average Crossover Strategy Rules
The rules of the moving average crossover strategy are:
- Place the 10 EMA and 50 EMA on your chart: Moving averages should be overlaid on your price charts, in particular the 10 and 50 exponential moving averages.
- Wait for the 10 EMA to cross above or below the 50 EMA: Waiting for the lower EMA to cross above or below the higher EMA is a signal of a potential trend change.
- Buying signal occurs when 10 EMA crosses above 50 EMA: The buy signal occurs when the 10 EMA is below the 50 EMA and the 10 EMA crosses above the 50 EMA.
- Shorting signal occurs when 10 EMA crosses below the 50 EMA: The short signal occurs when the 10 EMA is above the 50 EMA and the 10 EMA crosses below the 50 EMA.
- Stop loss should be placed above/below 10 EMA: Place the stop loss above/below the 10 EMA. This prevents
- Target should be a minimum 3 times the risk: The profit to risk ratio should be a minimum 3:1. This allows a trader to still be profitable with a low win rate percentage.
- Risk per trade no more than 1% of capital: A trader should risk at most 1% of trading capital when using this strategy.
These are the rules for the moving average trading strategy. A trader should study them and improve and tweak them to their own preferences.
Moving Average Crossover Strategy Price Chart Examples
Below are some examples of the moving average crossover strategy on price charts of different financial markets.
Example Buying Entry Of The Moving Average Crossover Strategy
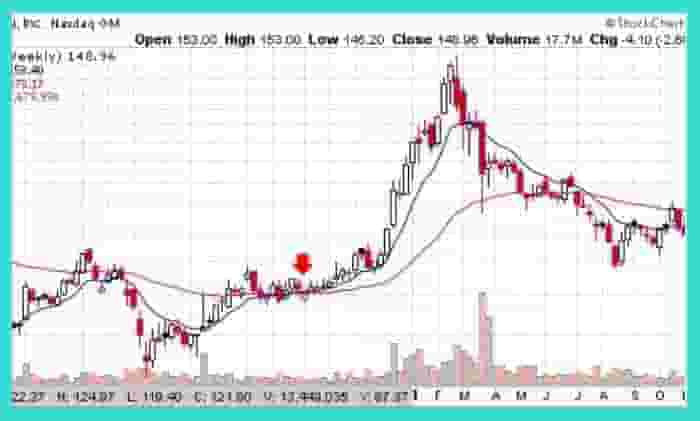
In the above weekly candlestick chart of Baidu, the entry across when the 10 EMA crosses above the 50 EMA (marked with the arrow).
This is an example of a buy entry using the strategy and in this price chart, there was a multi-week trend up after the entry.
Example Shorting Entry Of The Moving Average Crossover Strategy
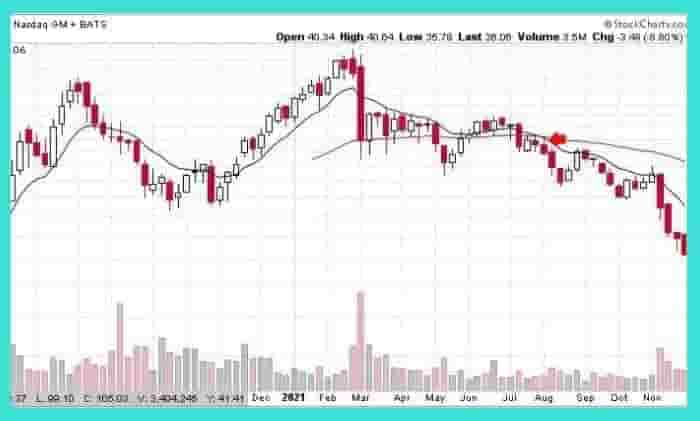
In the candlestick price chart of Schrodinger Inc. above, a short trigger is alerted when the 10 EMA crosses below the 50 EMA (red arrow on chart).
In this example, stop loss is placed just above the 10 EMA with a minimum target of 3 times the trades risk.
Moving Average Crossover Strategy Pros And Cons
There are a number of advantages and disadvantages to applying this technical analysis style trading strategy.
Moving Average Crossover Strategy Pros
The pros of using the moving average crossover strategy are:
- Easy to understand: This strategy is very beginner friendly and easy for most beginners to get started with.
- Can catch big winners when right: This trading strategy can help a trader to catch large trends in the market.
- Keeps risk small: Stops are placed near the 10 EMA and risk is no more than 1% of capital which means small losses when the trade is a loser.
- High risk reward ratio: The risk reward ratio could to be high when a trade is a winner.
These are the main pros of using this moving average strategy.
Moving Average Crossover Strategy Cons
The cons of using the moving average crossover trading strategy are:
- Very low win rate:The win rate for this strategy can be low, sometimes only 20% win rate so risk reward ratio needs to be high to be profitable.
- Losing trades add up in price consolidation periods: When the price chart of the tradable asset is choppy and consolidating (trading sideways), there tends to be a lot of losing trades and false buy and sell signals.
- Tends to be less reliable on lower timeframes: The moving average crossover strategy tends to give a lot of false and losing trade signals on very low timeframe charts e.g. 1 minute timeframe.
These are the main cons of the moving average strategy and should be considered before applying this strategy.
Stop Loss Reclaim Support/Resistance Strategy
The stop loss reclaim support/resistance strategy involves waiting for prices to take out stop loss areas around support/resistance levels and taking a trade if the price reclaims the support/resistance level again.
This technical trading strategy can be used on multiple timeframes from the 1 minute chart to the monthly chart.
Stop Loss Reclaim Support/Resistance Strategy Rules
The rules to trade the stop loss reclaim support/resistance strategy are:
- Mark clear support and resistance levels on price chart: Draw support/resistance levels on the price chart of any tradable instrument.
- Wait for price to penetrate these levels: Wait for the price to take out these levels. Typically, these levels are where many traders place their stop loss orders.
- Wait to see if price can reclaim the support/resistance level: Wait to see can the price reclaim the support/resistance level on the chart.
- Entry buy when price reclaims previous support: Buying triggers occur if price can reclaim the previous support level with stop loss placed at the newly formed low.
- Entry short when price reclaims previous resistance level: A shorting trigger occurs when price reclaims previous resistance levels with stop at the newly formed high.
- Risk reward should be a minimum of 3 to 1: A good risk reward ratio allows for being profitable with a low win rate.
- Risk should be no more than 0.5% – 1% of capital: The risk per trade should be kept very low, under 1% of trading capital per trade.
These are the rules for the stop loss support/resistance reclaim strategy. New traders can practice and improve upon them.
Stop Loss Reclaim Support/Resistance Strategy Price Chart Examples
Below are examples of the stop loss reclaim support/resistance level strategy in action.
Example Buy Entry Of The Stop Loss Support/Resistance Level Strategy
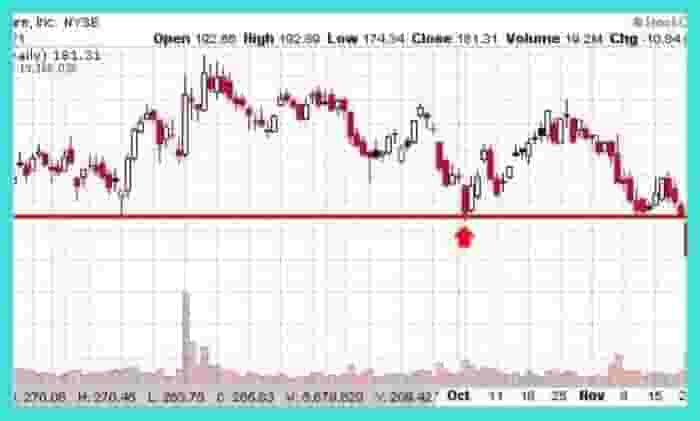
In the above candlestick chart of Square Inc., price trades below the support level (horizontal line) and immediately reclaims it.
Buy entry is taken at the red arrow on the chart when price reclaims support with a stop loss at the newly formed price low.
Example Short Entry Of The Stop Loss Support/Resistance Level Strategy
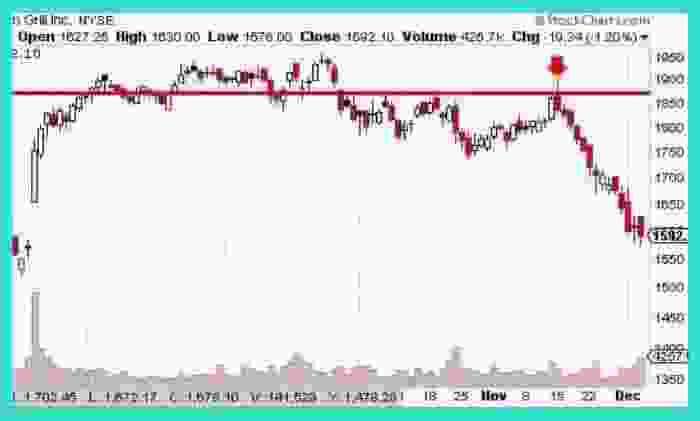
In the above candlestick price chart of Chipotle Mexican Grill Inc. price traded up through the resistance level (red horizontal line) where stop loss orders are placed.
The price traded through it and immediately came back below the resistance level.
The short entry occurs at the red arrow when the price trades back into previous resistance with a stop loss placed at the newly formed high.
Stop Loss Reclaim Support/Resistance Strategy Pros And Cons
There are advantages and disadvantages to using this trading strategy when trading the markets.
Stop Loss Reclaim Support/Resistance Strategy Pros
The pros of using the stop loss reclaim support/resistance strategy are:
- High risk reward ratio: This technical analysis strategy offers high risk reward ratio with a minimum of 3 times risk.
- Risks are small: Placing stop losses near the newly formed highs/lows and keeping position sizing to only risk less than 1% per trade means trading capital loss is kept to a minimum.
- Catch winning trades in sideways markets: When price is trading sideways or in a price consolidation, this strategy can help offer trading signals.
Stop Loss Reclaim Support/Resistance Strategy Cons
The cons of using the stop loss reclaim support/resistance strategy are:
- Low winning percentage: This strategy tends to have a low winning percentage and does not work well in trending markets.
- Losing trades add up in trending markets: When markets are trending, this strategy creates a large amount of losing trade signals.
These are the biggest cons of using this technical trading strategy. Any new trader should use a demo account to practice using this trading strategy.
3 Touch Trendline Buy/Short Strategy
The 3 touch trendline buy/short strategy offers traders the chance to catch a price trend with a low risk entry (provided stop losses are placed correctly)
The 3 touch trendline buy/short is a low-risk strategy that can be applied to multiple timeframes but works best on the higher timeframe charts.
3 Touch Trendline Buy/Short Strategy Rules
The rules of the 3 touch trendline trading strategy are:
- Wait for price to trend up or down: We need a clearly defined trend on a price chart.
- Draw a trendline with two levels of support/resistance: Draw a trendline with 2 levels of support/resistance on it and extend the trendline out.
- Entry long/short is when price reaches the trendline for the 3rd time: Wait for price to reach the trendline for a short/buy trade entry.
- Risk just above/under the trendline: Risk and stop losses should be placed above/under the trendline.
- Risk no more than 1% of trading capital per trade: Risk should be no more than 1% of trading capital per trade.
- Risk reward ratio minimum 3 to 1: A minimum risk reward using this strategy should be 3 to 1. i.e. for every $1 risked, a trader could potentially make $3.
A new trader should practice this technical analysis trading strategy on a demo account and work to improve upon it and make their own.
3 Touch Trendline Buy/Short Strategy Price Chart Examples
Below are examples of this strategy on price charts with both buying and shorting examples illustrated.
3 Touch Trendline Strategy Price Chart Buying Example
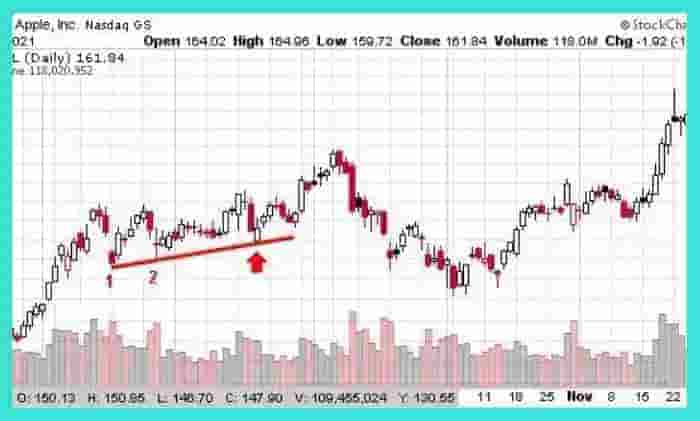
In the above candlestick price chart of Apple Inc., there is a price trend (red line).
Price touches trendline 3 times with the example buy when the price reaches the trendline for the third time (red arrow area on chart).
Stop loss is placed just below the trendline on the price chart.
3 Touch Trendline Strategy Price Chart Shorting Example
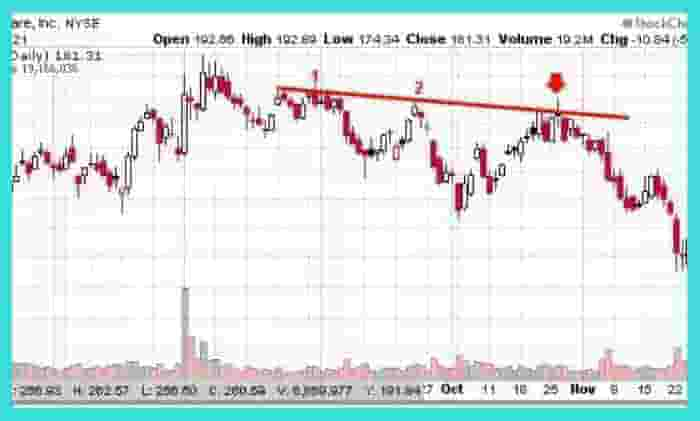
In the above price chart of Square Inc., a downtrend resistance level forms (red line) with a short entry example occurring at the red arrow when price touches the trendline for the third time.
Stop loss is placed above the trendline with a minimum profit-taking of 3 times the risk level.
3 Touch Trendline Buy/Short Strategy Pros And Cons
There are advantages and disadvantages to using this technical analysis style trading strategy.
3 Touch Trendline Buy/Short Strategy Pros
The pros of using the 3 touch trendline buy/short strategy are:
- Easy to apply: This strategy is easy to start with. Simply browse through charts and try and find the pattern in different markets.
- Can be used on multiple timeframes: This strategy can be applied on multiple timeframes from shorter 1 minute charts to longer monthly charts.
- Can be used on multiple markets: This strategy can be applied on many different markets from the stock market to the currency market.
- Can help a trader catch price trends: This strategy can help a trader get a low risk entry in a trending market.
These are the main benefits of learning this technical trading strategy.
3 Touch Trendline Buy/Short Strategy Cons
The cons of using the 3 touch trendline buy/short strategy are:
- Can have a low win rate in choppy markets: When the price chart is not trending in one direction, this strategy can have a low win rate.
- Few setups on higher timeframes: There are fewer amounts of these trading setups on higher timeframe charts.
These are the main disadvantages of using this trading strategy.
Frequently Asked Questions
Below are frequently asked questions about technical analysis strategies.
Are Technical Analysis Strategies Profitable?
Technical analysis strategies can be profitable depending on the specific technical analysis strategy used and the individual trader.
Evidence from the Market Wizards book series suggests that there are many top traders profitably applying a technical analysis style trading strategy ( 1).
What Are The Types Of Technical Analysis Strategies Used By Traders?
There are 2 types of technical analysis strategies used by traders:
- Trend Following Strategies
- Mean Reversion Strategies
A trend-following strategy is a strategy that attempts to follow price trends in the market.
A mean reversion strategy is a strategy that attempts to catch price reverting back to the mean.
