What Is A Technical Divergence?
A technical divergence in technical analysis is when the price of a financial market moves in the opposite direction to a technical indicator like an oscillator i.e. there is a divergence between the direction of the price of an asset and the direction of the technical indicator.
A technical divergence signals that a price reversal is about to occur in the financial market where it forms.
Types Of Technical Divergences
There are two types of technical divergences in technical analysis. The two types of technical divergences are:
- Positive Divergence: A positive divergence, also known as a bullish divergence, signals that the price of a financial market may reverse from bearish to bullish and increase in price soon. It occurs when the price is moving lower but the technical indicator is not also moving lower.
- Negative Divergence: A negative divergence, also known as a bearish divergence, signals that the price of a financial market may reverse from bullish to bearish and decrease in price soon. It occurs when the price is moving higher but the technical indicator is not also moving higher.
These two divergences will signal potential future bullish or bearish price movements in the market where they occur.
Technical Divergence Indicators
To find technical divergences in a financial market, a trader or technical analyst will need access to certain technical analysis based indicators.
Typically, to find technical divergence in a market, oscillator indicators or momentum indicators are required.
Examples of technical indicators needed to find technical divergences in a financial market include:
- Relative Strength Index (R.S.I.)
- Moving Average Convergence Divergence (MACD)
- Stochastics
- Commodity Channel Index (CCI)
- Awesome Oscillator (AO)
A trader or technical analyst will only need access to one of these trading indicators to find technical divergences in a market.
The most popular indicator used to spot technical divergences is the RSI indicator.
Technical Divergence Examples
Below are visual chart examples of technical divergences in various financial markets.
Example Of A Positive Technical Divergence

In the above price chart, there is a positive technical divergence that formed.
The price of the market formed lower lows on the price chart while at the same time the technical indicator formed higher lows.
This signals a technical divergence between the price of the market and the technical indicator.
As a result, there is a potential for the price of the market to reverse from a bearish trend to a bullish one and that is exactly what happened in this example.
Example Of A Negative Technical Divergence
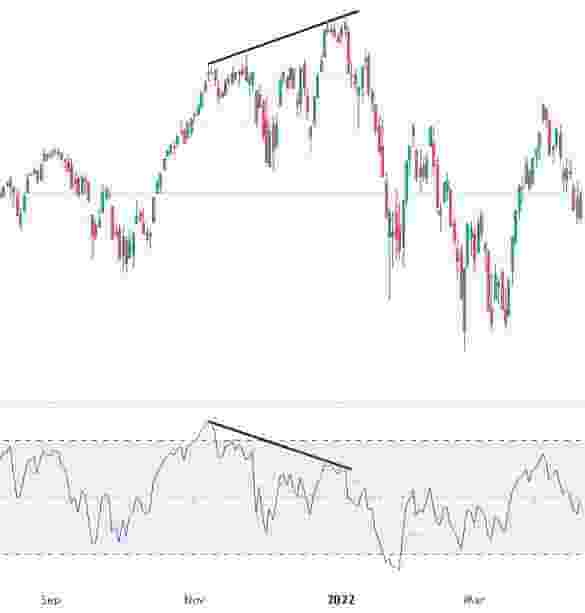
In the above price chart, there is a negative technical divergence that formed.
At the bottom of the chart, the technical indicator formed lower highs while at the same time the price of the market made higher highs.
This signals a technical divergence between the price of the market and the indicator.
As a result, there is a potential for the price of the market to reverse from bullish to bearish and that is exactly what happened in this example.
Example Of A Technical Divergence Using The R.S.I. Indicator
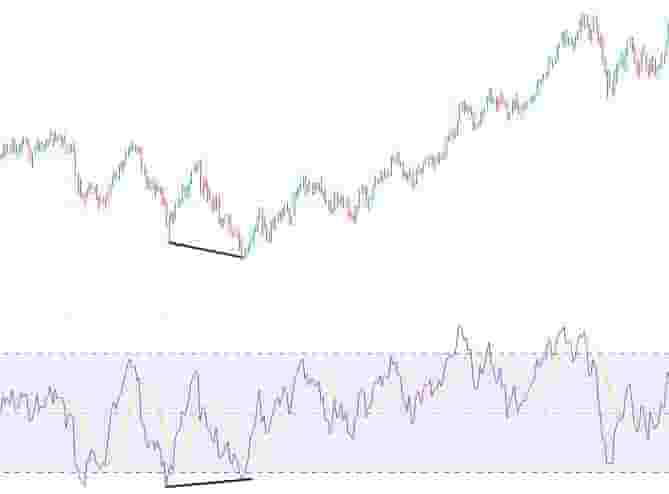
In the above price chart, there is a technical divergence between the price chart and the relative strength index.
The price of the market formed lower lows while the R.S.I. formed higher lows at the same time.
As a result, there is a potential for the price of the market from bearish to bullish.
Example Of A Technical Divergence Using The MACD Indicator
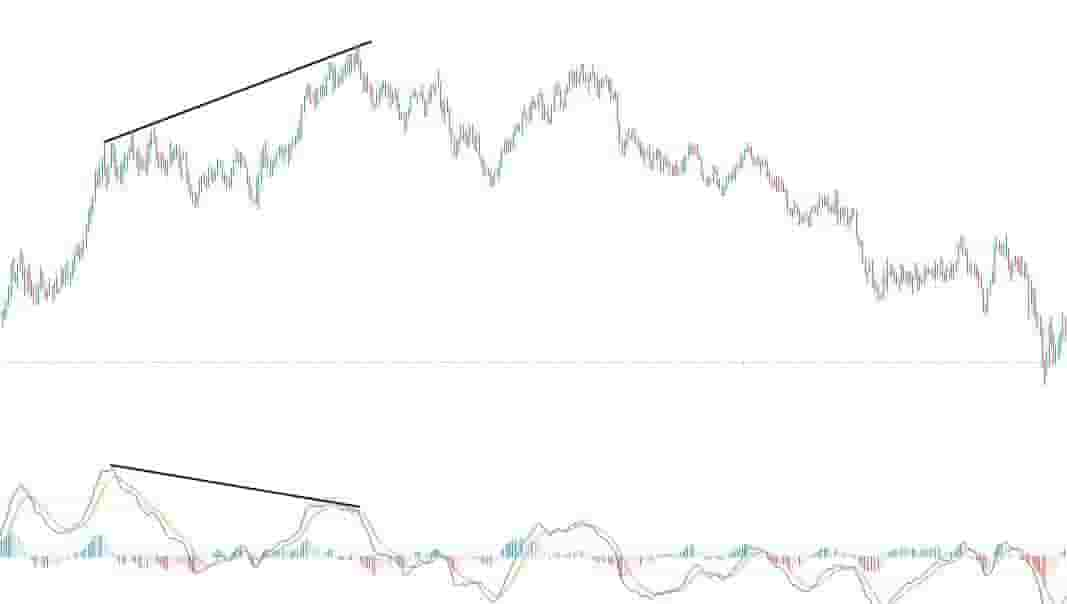
In the above price chart, there is a negative technical divergence that formed between the price of the market and the MACD indicator.
The MACD indicator formed lower highs while the price of the market simultaneously formed higher highs.
This signals a technical divergence between the price and the MACD indicator.
As a result, there is a potential for the price of the market to reverse from bullish to bearish and this is what occurred in this example.
Example Of A Technical Divergence Using The Stochastics Indicator
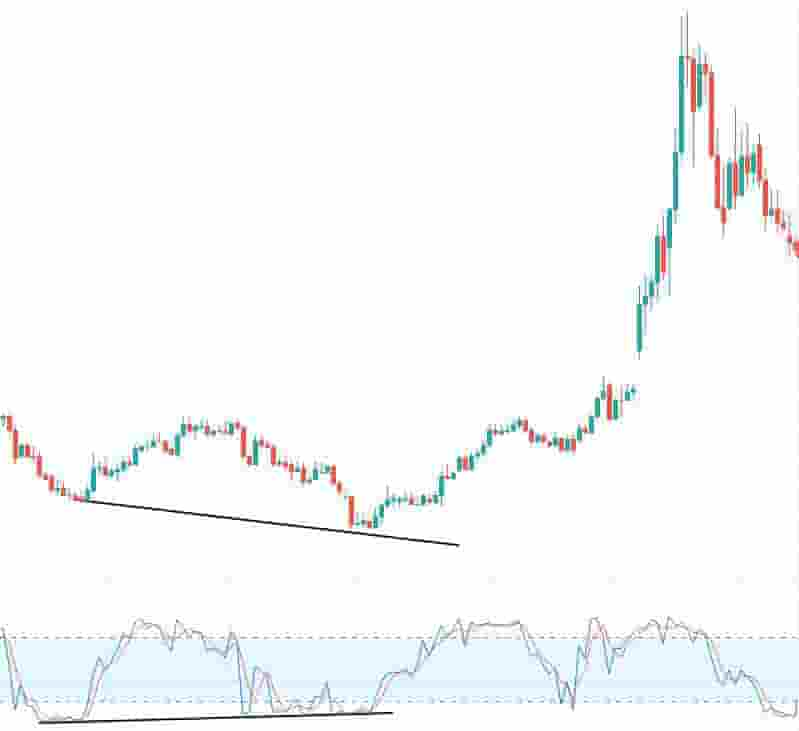
In the above price chart, a positive or bullish divergence occurred between the price of the market and the Stochastics indicator.
As the price of the market made lower lows in price, the stochastics indicator simultaneously formed higher lows at the exact same time.
This is a signal that the price of the market may reverse from bearish to bullish and that is exactly what happened in the above example.
Example Of A Technical Divergence Using The Commodity Channel Index (CCI)
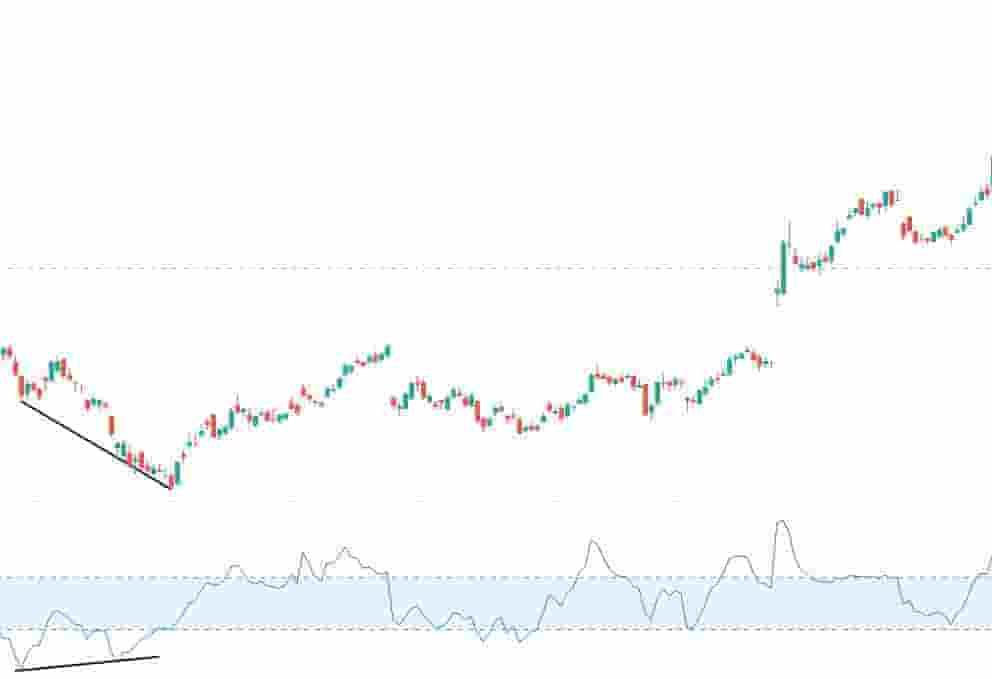
In the above price chart, there is a positive technical divergence between the commodity channel index indicator and the price of the market.
The price of the market makes a lower low while the commodity channel index indicator makes a higher low.
This signals that the price of the market may reverse from bearish to bullish and this is exactly what occurred in this example.
Example Of A Technical Divergence Using The Awesome Oscillator Indicator

In the above price chart, there is a technical divergence that formed between the price of the market and the awesome oscillator indicator.
The awesome oscillator indicator made higher lows while the price of the market made lower lows at the same time.
This signals a positive technical divergence and that the price will reverse from bearish to bullish which is exactly what occurred in this example.
How To Use Technical Divergences
To use technical divergences for trading:
- Scan through markets and wait for divergences: Browse through various financial markets and look for technical divergences between technical indicators like the R.S.I. and the price of the market.
- Use technical divergence with a current strategy: Use the technical divergence as a confirmation signal with your own trading strategy i.e. if your trading strategy signals to short and there is a negative technical divergence, this could be a signal that the short trade has a higher probability of being profitable.
- Use technical divergence for a signal of taking profits: When a technical divergence occurs for trend following trading strategies, it can be used as a sign that the trend may be losing momentum and it's time to exit the trade.
Technical divergences are mainly used in trading as a confirmation signal or as a signal to take profits on a trade as a price reversal may occur soon.
They are incorporated into trading strategies with other technical indicators, chart patterns and candlestick patterns.
Technical Divergence Benefits
The benefits of using technical divergences when doing technical analysis are:
- It adds confirmation to other technical signals: Technical divergence can help provide confirmation to other technical analysis signals.
- It can help traders understand the price action: Technical divergences can provide some logic to the price action and market conditions where they occur for traders.
- It can be used in any market: Technical divergences can be used in any financial market where they occur and are not limited to just a few markets like some other technical analysis tools.
- It is easy to learn: Many new traders can easily spot technical divergences in a market as it is easy to learn how to spot them and new traders learn this technique quickly.
Technical Divergence Limitations
The limitations when using technical divergences in technical analysis are:
- It has a low win rate: Technical divergences tend to have a low win rate with being accurate in predicting price reversals.
- It's not best to use it on its own: Technical divergences are not best to be used on their own as the sole reason for a trader to enter and exit a trade.
- It doesn't work great on shorter timeframes: Technical divergences tend to be even less accurate when used on shorter timeframe price charts.
These are the main limitations of using technical divergences that a trader should be aware of.
