What Is A Technical Indicator?
Technical indicators or “trading indicators” are mathematical based tools calculated by using the historical price data, volume data or open interest data of a financial instrument.
They are used by traders, investors and technical analysts who follow technical analysis to help predict or “indicate” the future price movement in a financial market.
Technical indicators help find chart patterns, buying and shorting signals in various markets around the world. They can be overlaid on the price chart of a market or above or below the price chart.
Types Of Technical Indicators
There are two main types of technical analysis indicators. These are:
- Oscillators: These are technical indicators that indicate when a market is at an extreme level, either an overbought extreme or an oversold extreme. They are plotted on a different scale than the price, typically found either above or below a price chart. Examples include the R.S.I., Money Flow Index and the Accumulation/Distribution Line.
- Overlays: These are technical indicators that are plotted on the same scale as the price of a financial instrument and overlay on the price chart. Examples include Bollinger Bands, Moving Averages and Keltner Channels.
The majority of technical analysis indicators fall into these 2 types.
Examples Of Technical Indicators
There are hundreds of technical indicators that traders and investors can use to analyze financial markets.
Examples of technical indicators include:
- Bollinger Bands
- Money Flow Index
- Ichimoku Clouds
- Relative Strength Index (R.S.I.)
- Moving Averages
- Advance Decline Line
- Average True Range
- Chaikin Oscillator
- Keltner Channels
- On Balance Volume
- Stochastics
Below are multiple examples of different technical indicators on price charts.
Example Of The Technical Indicator Called “Bollinger Bands”
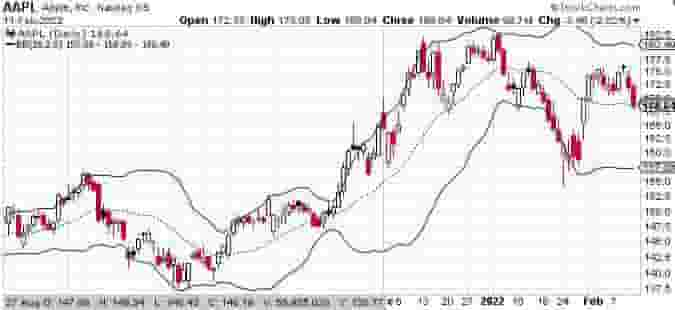
The price chart of Apple stock below has the overlay technical indicator known as Bollinger Bands plotted onto it.

The Bollinger Bands are overlaid on the price chart in the form of the 3 bands, an upper, lower and middle band.
Example Of The Technical Indicator Called “Moving Averages”
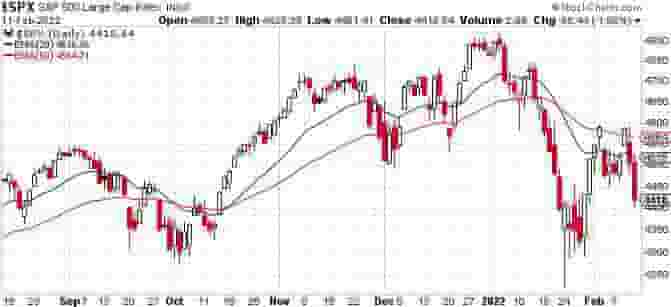
The price chart of the S&P500 below has the Moving average technical indicator plotted onto it.

The 2 moving averages in this example are the 20 period and 50 period Exponential Moving Averages, plotted as a blue and red line.
Example Of The Technical Indicator Called “R.S.I.”
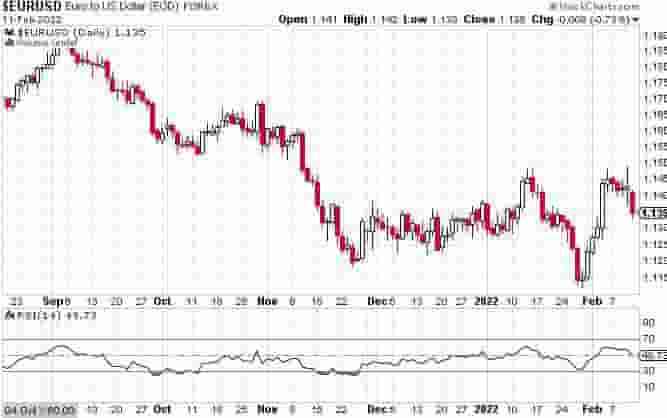
The price chart of the EUR/USD currency pair below has the R.S.I. indicator plotted below the price chart.

The R.S.I. is an oscillator type technical indicator that plots when the market is overbought, oversold or neutral.
Example Of The Technical Indicator Called “Keltner Channels”
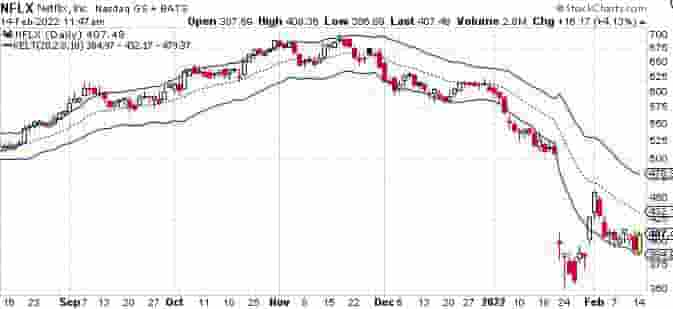
The price chart of Netflix (NFLX) below has the overlay technical indicator called Keltner Channels on it.

The Keltner channels is another example of technical analysis indicator. It is mainly used for trend following in different capital markets.
The indicator is displayed as 3 bands, an upper, middle and lower band.
Traders use these bands to buy when price trades above the upper band and short a market when price breaks below the lower band.
What Can Technical Indicators Be Used For?
Technical indicators can be used for:
- Entry and exit points for a trade or investment
- Analyzing the overall health of a financial market
- Analyzing whether the trend is bullish or bearish
- Assessing when markets are extremely volatile
- Assessing when markets are in overbought or oversold conditions
- Developing a technical analysis trading strategy
- Developing a trading algorithm
- Helping with trade management
- Helping to predict the future price movement in a financial market
- Analyzing both short term or longer term price charts of markets
These are the main use cases for technical indicators.
What Markets Can Technical Indicators Be Used?
Technical indicators can be used in any financial market with historical price data. Example markets include:
- Stocks: This includes stocks within markets around the globe, some well known examples include Apple (AAPL), Ford (F), Tesla (TSLA), Microsoft (MSFT) etc.
- Forex: This includes currency markets like Euro, Dollar, Yen, Pound Sterling etc.
- CryptocurrenciesThis includes cryptocurrencies like Bitcoin, Ethereum, Cardano, Solana etc.
- Bonds: This includes bonds like the United States 10 Year Government Bond, Australia 10 Year Government Bond, Germany 10 Year Government Bond etc.
- Commodities: This includes commodity markets like Crude Oil, Heating Oil, Corn, Soybeans, Coffee, Gold, Silver etc.
- Indices: This includes indices like the S&P500, Nasdaq 100, Nifty 50, Nikkei etc.
- Futures: This includes future markets like the E-Mini S&P500, BankNifty Index Futures, Dax Futures etc.
- Options: This includes option markets of stocks, indexes like Apple stock options, Baidu stock options, Netflix stock options etc.
Once a market has historical price data available, a technical indicator can be used.
Without historical price data, there is no data for these technical indicators to work from.
What’s The Difference Between Technical Indicators And Fundamental Indicators?
The difference between technical indicators and fundamental indicators are:
- Technical indicators focus on historical price data, volume and open interest whereas fundamental indicators look at things like earnings, company news, profit margins, revenue etc.
- Technical indicators help predict future price movements in the short to medium term timeframe whereas fundamental indicators help predict the intrinsic value of a market/company.
- Technical indicators can be used frequently and in real time whereas fundamental indicators can only be applied a few times a year in some instances e.g. earning releases.
These are the main differences between the two types of indicators.
Can Technical Indicators Be Used in Day Trading and Swing Trading?
Yes, technical indicators can be used in both day trading and swing trading. There are also day trading specific indicators and swing trading indicators that traders use.
