
What Is a Triple Top Pattern In Technical Analysis?
A triple top pattern is a bearish pattern in technical analysis that signals a price reversal from a bullish trend to a bearish trend. The pattern forms at a market top after an extended uptrend and it consists of three distinct swing high resistance prices (three peaks) and a sloping or horizontal support level connecting the swing low prices together. Triple tops are a bearish signal. Triple top pattern formation completion occurs when a market price downside breakout occurs below the support area.
What Does a Triple Top Pattern Mean In Technical Analysis?
A triple top pattern formation means a reduction in market buying pressure, declining prices and a downward trend in a market security where the pattern forms after the price drops below the pattern's support point.
What Are The Alternative Names For a Triple Top Pattern?
A triple top pattern's alternative names are a "three top pattern" or a "triple top reversal" pattern.
Is a Triple Top Pattern Bullish or Bearish?
A triple top pattern is a bearish reversal pattern that signals lower prices and a continued decline in prices. It is not bullish.
Is a Triple Top Pattern a Reversal Or Continuation Pattern?
A triple top pattern is a reversal pattern signaling price reversals and is not a continuation pattern.
What Is The Importance Of a Triple Top Pattern?
The triple top pattern is important for signaling a bearish price reversal in capital markets and a market dynamics shift from high demand to high supply and it is important as it predicts potential price exhaustion in bull trends.
What Technical Indicators Are Used With Triple Top Patterns?
Triple top patterns are used with technical indicators including the exponential moving average overlay, volume indicator, moving average convergence divergence (MACD), volume weighted average price (VWAP), bollinger bands, keltner channels, and the RSI oscillator in technical analysis. These trading indicators help find a technical reversal and trend changes.
What Is A Confirmation Indicator Used With Triple Tops?
The triple top pattern confirmation indicator is the volume indicator which measures trading volume and shifts in market sentiment and this technical indicator helps identify when there is heavy selling pressure after the price breakout below the pattern's support price trendline. A volume surge during the breakdown adds weight to the validity of the pattern, suggesting that there is strong selling interest supporting the bearish price reversal and that big traders have started selling.
What Are The Components Of a Triple Top Pattern?
The 4 triple top pattern components are a left swing high peak, middle swing high peak, right swing high peak, and a support trend line.
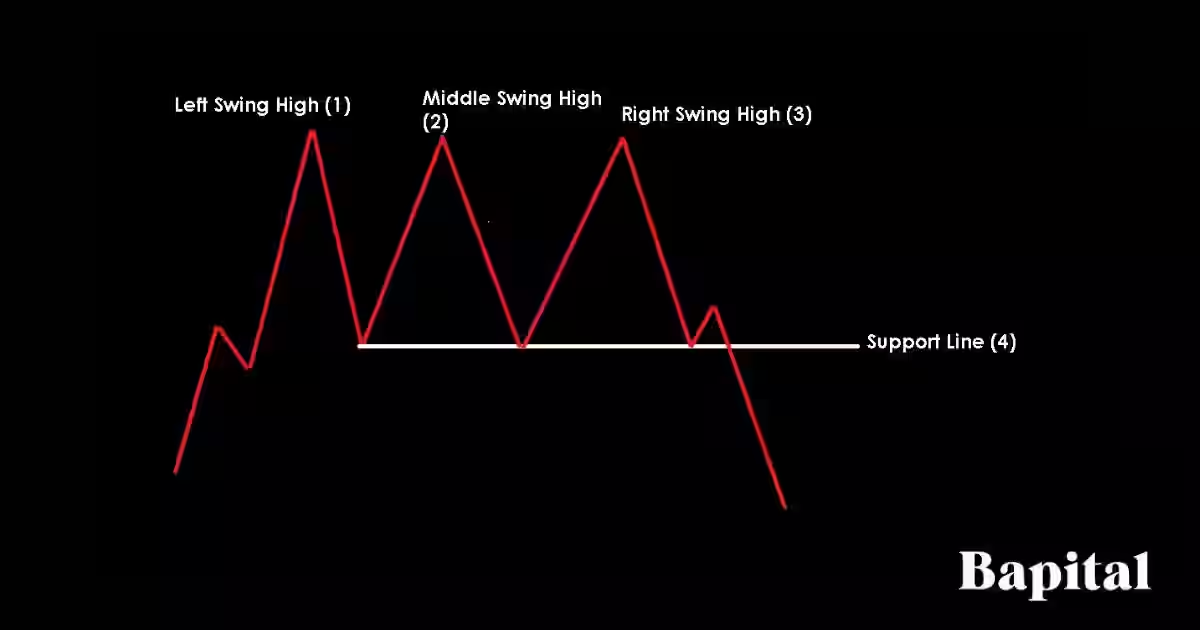
1. Left Swing High Peak
The triple top left swing high price peak component is the first resistance peak of this pattern and is located on the left side of the pattern. It forms when the market price reaches buyer exhaustion and the price struggles to move higher and instead retraces.
2. Middle Swing High Peak
The triple top middle swing high price peak component is the second resistance peak of this pattern and is located in the middle of the pattern. It forms when the price attempts to break the first high price resistance but fails.
3. Right Swing High Peak
The triple top right swing high price peak component is the third resistance area of this pattern and is located on the right side of the pattern. It forms when the price rises and makes a third attempt to breakout but fails to move higher and retraces.
4. Support Level
The triple top support level is below the 3 swing high peaks and it connects the swing low prices together either through a horizontal trendline, a slanted upward trendline, or a slanted downward trendline. A breach of the support zone is the short trade entry price.
What Is The Formation Process Of a Triple Pattern?
The triple top formation process starts firstly with an established bullish uptrend which is caused by a series of higher swing highs and higher swing lows and rallying prices. This initial uptrend typically sees asset prices increase by 10% or more depending on the market.
Secondly in the triple top formation process is the price consolidation period. This price consolidation phase is caused by the price beginning to consolidate for a period of time within a price range indicating that the market is nearing a market top. During this period, price tends to whipsaw and be volatile within a narrow range with neither buyers or sellers in control. This period creates three distinctive swing high resistance prices and multiple swing low support prices.
Thirdly in the triple top formation process is the bearish price breakdown which is caused by prices dropping below the support point, marked by a series of lower highs and lower lows.
What Happens After a Triple Top Pattern Forms?
After a triple top formation, the market price reverses from bullish to bearish and starts dropping lower in a bearish direction to lower prices.
What Causes a Triple Pattern To Form?
A triple top pattern is caused by a bullish price trend exhaustion with buyers struggling to push the price higher. As the price struggles, the asset price makes three distinctive market top resistance area with these market top points being met with sellers. The market price breakdown component of the pattenr is caused by bullish traders selling their positions and new short sellers entering the market.
How Long Does a Triple Top Pattern Take To Form?
A triple top pattern formation duration is 80+ minutes on a 1-minute price chart to 80+ years on a yearly price chart. To calculate the triple top formation time, multiple the chart timeframe used by 80. For example, a 15-minute timeframe price chart means a triple top pattern will take a minimum of 20 hours (15 minutes x 80) to form.
How Often Do Triple Tops Form?
Triple top patterns form once or twice per year on a daily price chart depending on the market environment.
What Type Of Price Charts Do Triple Tops Form On?
Triple top patterns form on bar charts, candlestick charts, open high low close charts (OHLC), point and figure charts, area charts, and line charts.
What Markets Do Triple Top Patterns Form In?
The triple top pattern forms in all global markets including stock markets, currency (forex) markets, cryptocurrency markets, options markets, futures markets, indices, commodity markets, exchange traded funds (ETFs), and bond markets.
What Timeframe Price Charts Do Triple Top Patterns Form On?
Triple tops form on all timeframes from shorter term tick charts to longer term yearly price charts without any restrictions in timeframes.
How Do Traders Identify Triple Tops?
A triple top pattern is identified when the market price reaches the same resistace point three times. First, observe a market security in an upward trend as before a triple top forms, there should be a preceding bullish uptrend. Look for three peaks at approximately the same price level with each peak followed by a temporary price decline. Identify the troughs that form between each of the three peaks and these troughs low points are connected by a support trendline. Observe a price breakdown under the support line after the third swing high peak and the breakdown should be accompanied by increased selling volume.
How Do Traders Find Triple Top Patterns?
Triple tops are found by scanning the financial markets with a triple top charting scannner, checking the online social profiles of top traders or expert chartered market technicians (CMT), browsing the price charts manually, or by checking online trading broker software.
How Do Traders Scan For Triple Top Patterns?
Traders scan for triple top patterns by using a custom script to scan for triple tops, using Finviz chart pattern screener, using TradingView screeners, or using trading broker pattern scanners to scan.
How Do Traders Draw a Triple Top Pattern?
A triple top pattern drawing begins with marking the first resistance point on the left side of the pattern with the number "1", the second resistance point in the center of the pattern with the number "2", and the third resistance point on the right side of the pattern with the number "3". Then draw a support neckline from left to right that connects the swing low points of the pattern together. This marks the completion of the pattern drawing.
Can Triple Tops Have Variations in Shape or Size?
Yes, triple tops can exhibit shape variation and size variation. While the classical depiction of a triple top pattern involves three peaks of roughly equal height, the reality in the financial markets can be more nuanced. The traditional triple top is a symmetrical triple top with three peaks of roughly eqaul height. However, an asymmetrical triple top has three peaks of slightly uneven height.
How To Trade Triple Tops
The triple top pattern trading steps are below.
- Identify a triple top at the end of a bullish trend
- Enter a short trade position when the asset price falls below the support price trendline
- Set price target by taking the height measurement between support and resistance lines and subtracting this number from the sell entry price
- Place a stop-loss order at the high price of the price breakdown candlestick
- Conduct post-trade analysis

1. Identify a Triple Top At The End Of A Bullish Trend
The first triple top pattern trading step is to identify the triple top in a market. Scan for triple tops using a pattern scanner or browse the price charts manually for the pattern formation.
2. Enter A Short Trade Position When The Asset Price Falls Below The Support Price Trendline
Place a short trade when the price drops below the pattern support line. After shorting the market, watch the volume indicator for an increase in selling volume as this acts as a selling pressure confirmation signal for traders.
What Is the Triple Top Pattern Entry Point?
The triple top short trade entry point is set right as the asset price breaks below the predefined pattern's support line. This support zone breach is the sell signal and this is known as the tripe top breakout level.
3. Set A Price Target Order
The third triple top pattern trading step is to place a profit target order by calculating the height distance between the pattern high and low and subtract this to get the take profit level.
What Is The Price Target Of a Triple Top Pattern?
A triple top pattern price target is set by taking the height between the swing high price and the support level and subtracting this calculation from the support level to determine a price target.
For example, if the pattern's swing high price is $40 and the pattern's support level is $30, the distance between the swing high and the support level is $10. The $10 is subtracted from the breakout point of $30 to get a profit target exit of $20 in this example. All short trade positions are closed at this price point. This method of calculating the height helps traders determine and understand the estimated downside of a price movement and easily identify an estimated target.
What Is The Price Target Calculation Formula Of a Triple Top Pattern?
The triple top price target calculation formula is: Triple Top Price Target = Short Entry Price - Height Between Swing High Price and Support Level Price.
4. Place A Stop-Loss Order At The High Price Of The Price Breakdown Candlestick
The fourth triple top pattern trading step is to place a stop-loss at the high point of the support breakdown candlestick.
What Is The Risk Management When Trading Triple Tops?
Triple top trade risk management involves placing a stop-loss order at the high price of the breakdown candlestick. Setting stop-loss orders above the breakout points improves reward risk ratio. Traders typically risk no more than 1% of their trading capital and adjust their position sizes appropriately to match this capital risk. A stop loss order works to protect shorts against large trading losses.
How To Reduce Triple Top Pattern Trading Risk
Triple top pattern trading risk is reduced by trading smaller sized positions, not trading the pattern around important news or economic announcements, and avoiding illiquid markets with low trading volume.
What Is The Reward/Risk Ratio Of a Triple Top Pattern?
The triple top pattern reward-risk ratio is 2:1 meaning $2+ reward for every $1 risked.
What Are The Risks Of Trading a Triple Top Pattern?
The triple top pattern trading risks are the price gapping up causing trading losses, volatility increasing,
What Are Common Mistakes When Trading Triple Top Patterns?
The triple top pattern common trading mistakes are risking more than 1% of capital per trade, trading right before volatile news announcements, and not understanding the exit price before entering the trade.
5. Conduct Post-Trade Analysis
The fifth triple top pattern trading step is to conduct post-trade analysis. Include trade information including entry points, exit points, stop-loss points, trader psychology, trading rule adherence, trader discipline, and annotated charts in the trade analysis.
What Are The Rules Of Trading a Triple Top Pattern?
The triple top pattern rules are below.
- Risk 1% of trading capital total
- Avoid trading prior or during market news events
- Avoid trading the pattern in illiquid markets
- Enter a short position when price penetrates the support point only
- Calculate the trade entry price, trade exit price, trade stop loss price, and trade position size prior to trade entry
- Analyze the seller volume as the price breaks support
What Is a Triple Top Pattern Trading Strategy?
A triple top pattern trading strategy is the 10EMA triple top trailing stop strategy. Enter a short position when a market security penetrates the daily candlestick pattern support area on rising volume. Watch the volume indicator for increases in selling pressure as the price breaks lower. Use a 10 exponential moving average (ema) overlay and trail a trailing stop-loss order along the 10 ema. When the candlestick closes above the 10 ema, take profits and close the short trade.
This triple top trading strategy is for a swing trading style but it can be utilized with a day trading style by changing the daily chart timeframe to intraday charts.
What Type Of Trading Strategies Trade Triple Top Patterns?
Triple tops are traded in scalping strategies, day trading stategies, swing trading strategies, position trading strategies, and investing strategies.
What Type Of Traders Trade Triple Top Patterns?
Triple top patterns are traded by scalpers, day traders, swing traders, position traders, professional technical analysts, and active investors.
What Are Examples Of a Triple Top Pattern?
Triple top chart patterns examples are below.
Triple Top Stock Market Example

A triple top pattern stock market example is illustrated on the daily Block Inc. (SQ) chart of above. Three swing high price peaks form and a horizontal support price level indicating the pattern. The asset price drops below the support level and declines in a bearish downtrend over the new few weeks to reach the target level.
Triple Top Forex Market Example

A triple top pattern forex market example is illustrated on the daily forex price chart image of GBP/USD above. The chart shows three swing high price points forming and an upward sloping support trendline which helps identify the pattern on the currency price chart. The currency price breaks down and falls below the support level and declines in a downward trend to the trade exit level.
Triple Top Short Timeframe Example

A triple top pattern short timeframe example is shown on the 3-minute Li Auto Inc (Li) stock chart above. Three swing high resistance prices form with a horizontal support line which helps identify the pattern on the stock price chart. The market security breaks down and falls below the support area and gaps down much lower over the next few hours to take profit level.
Triple Top Long Timeframe Example

A triple top pattern long timeframe example is displayed on the weekly Expedia (EXPE) stock chart above. Three swing high resistance prices form with a sloping support line which helps identify the pattern on the market chart. The market asset pulls back and breaks down below the support level, rallies back to retest the trendline and then trends lower over the new few weeks to the trade exit point.
What Are The Benefits Of a Triple Top Pattern?
The triple top pattern benefits are below.
- Helps Capture Large Bearish Trends: A triple top pattern helps a trader to predict and capture a large bearish price move in market assets when the pattern forms and triggers a short trade
- Easy To Learn: A triple top pattern is easy for new traders to learn with three peaks and a support line to understand
- Favorable Reward/Risk Ratio: A triple top offers a 2:1 reward to risk ratio meaning risking $1 to make $2+ on every trade
- Universal Market Application: The triple top pattern is applied in all global financial market including stocks, bonds, etfs, futures, commodities, forex, options, cryptocurrencies, and indices
- Multiple Timeframe Application: Triples tops can be applied to all timeframes from intraday 1-second market charts to yearly price charts without restrictions
- Helps Provide Early Warning Signs: A triple top pattern offers early warning signs for bullish traders that the bull trend may be reaching a trend exhaustion period with waning buying interest and taking profits may be the best decision
- Clear Trade Management Procedure: A triple top pattern provides clear trading management procedures with a clear entry zone, clear exit zone, and clear stop-loss zone provided when interpreting the pattern
What Are The Limitations Of a Triple Top Pattern?
The triple top pattern limitations are below.
- False Breakdown Signals: A triple top can trigger fake breakouts whereby the price falls but may not continue to move lower and instead move sideways in a volatile manner or have a bullish reversal
- Not Foolproof: Triple tops are not foolproof. Markets are complex and various factors influence price movements. Traders should use triple tops as part of a comprehensive analysis rather than relying solely on this pattern for trade decision-making
- Ineffective In Volatile Markets: A triple top pattern is ineffective in extremely volatile markets with large price spikes and whipsawing prices making it harder to understand the market price action
What Is a Triple Top Pattern Failure?
A triple top pattern failure, also known as a "failed triple top reversal", is when a triple top forms but prices fail to contine lower. The triple top pattern is invalidated and fails when the market price drops below the short entry point in a bearish movement but reverses from below the support point to trend higher above the pattern's three swing high resistance peaks. A failed triple top pattern is a bullish signal.

What Causes a Triple Top Pattern To Fail?
The triple top pattern failure causes are below.
- Low Volume: A triple top pattern can fail if there is little selling volume (red bars) as the price breaks down. Less sell volume means fewer sellers are pushing the price lower
- Unexpected Market News: Unexpected political and economic news can increase price volatility and cause the triple top pattern to fail
- Big Support Level: A big support level below the pattern breakdown area can cause a bullish price bounce and the pattern to fail
What Is The Psychology Behind a Triple Top Pattern?
Triple top pattern psychology involves market participants experiencing diminishing optimism about an asset's future price increase. Initially, the asset reaches a resistance zone, triggering profit-taking among some traders. After the first and second peaks, buyers struggle to push the price higher, leading to a third attempt and subsequent failure.
This repeated failure to breach the resistance point signals a shift in sentiment with sellers gaining confidence, anticipating a market reversal. The triple top reflects a struggle between bullish and bearish forces, culminating in a potential price trend reversal as the market sentiment shifts from bullish to bearish negative sentiment and weakening prices.
What Are The Statistics Of Triple Top Patterns?
The triple top pattern statistical data is below.
How Accurate Is a Triple Top Pattern?
Triple top pattern's win rate is 41% from our backtesting data of analyzing 1,710 of these chart pattern formations. A triple top is deemed a success when the asset price reaches target.
Is a Triple Top Pattern Reliable?
Yes, a triple top pattern is reliable is reliable if the trading rules are strictly followed. Triple tops are more reliable on higher timeframe market charts and less reliable on lower timeframe market charts.
What Market Conditions Is a Triple Top Pattern Most Reliable?
The triple top pattern most reliable market conditions are in trending markets when market prices are moving in clear trends.
What Market Conditions Is a Triple Top Pattern The Least Reliable?
The triple top pattern least reliable market conditions is choppy sideways, and rangebound market conditions with price flucuating in narrow range between support and resistance levels with no clear trend direction..
Is a Triple Top Pattern Profitable?
Yes, a triple pattern is profitable as the average success rate is 41% and the average return to risk ratio is 2 to 1. This means for every 100 trades, a trader wins 41 trades making 2 units (82 units total) and loses 59 trades losing 1 unit (59 units total). Therefore, over 100 trades, a trader should hypothetically net 23 units (82 units - 59 units). Be aware that past triple top pattern performance is not indicative of future trade results.
What Are The Alternatives Of a Triple Top Pattern?
Triple top pattern alternaives are listed below.
- Double top pattern
- Rising wedge pattern
- Head and shoulder pattern
- Bump and run reversal pattern
- Rounding top
- Bearish rectangle pattern
What Is The Opposite Of a Triple Top?
The opposite of a bearish triple top pattern is the bullish triple bottom pattern.
What's The Difference Between a Triple Top vs Double Top Pattern?
A triple top pattern's difference with a double top is its shape with a triple top having three peak resistance points while a double top has two peak resistance points.
What's The Difference Between a Triple Top vs Triple Bottom Pattern?
The triple top pattern differences with the triple bottom pattern are what it indicates and its shape. A triple top pattern is a bearish signal that indicates potential falling prices while a triple bottom pattern is a bullish signal that indicates potential price increases. A triple top is shaped with three swing high resistance points while a triple bottom is shaped with three swing low support points. A triple bottom looks like a triple top pattern turned upside-down.
What's The Difference Between a Triple Top vs Head and Shoulders Pattern?
A triple top's difference with a head and shoulders pattern is its shape with the triple top having three peak resistance points of the same height while a head and shoulders pattern's second peak is higher than its first peak and third peak.
Triple Top Pattern Key Facts
The triple top key facts are below.