What Is a Price Channel Pattern in Technical Analysis?
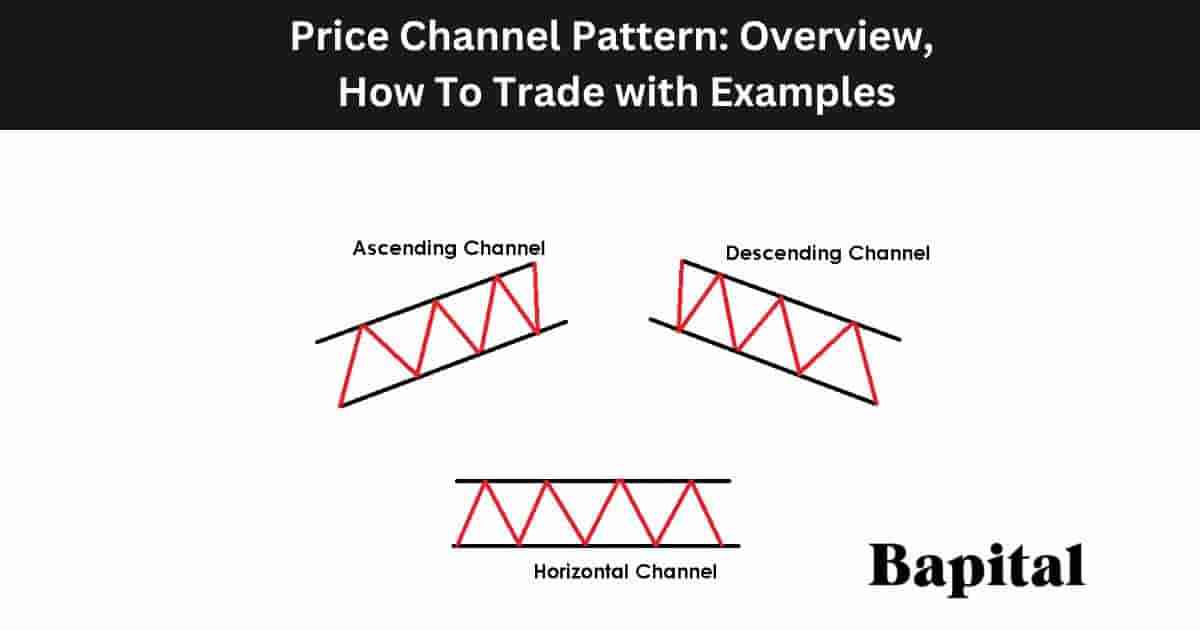
A price channel is a pattern in technical analysis that signals the market price is moving within a price range between a support level and a resistance level. There are three types of price channels which are ascending price channels which indicate further bullish price movements, descending price channels which indicate further bearish price movements, and horizontal price channels which indicate further sideways price trends. Price channels are continuation patterns and signal a continued move in the underlying trend direction.
What Are The Types Of Price Channels?
The three price channel pattern types are ascending channels, descending channels, and horizontal channels.
1. Ascending Channel
An ascending channel is a pattern that forms when market prices oscillates between a parallel rising resistance level and a rising support level in a bullish trend. An ascending channel requires a minimum of three rising swing high prices and three rising swing low prices. An ascending channel is also referred to as a "bullish channel".
2. Descending Channel
A descending channel is a pattern that forms when market prices oscillates between a parallel declining resistance level and a declining support level in a bearish trend. A descending channel requires a minimum of three lower swing high prices and three lower swing low prices. A descending channel is also referred to as a "bearish channel".
3. Horizontal Channel
A horizontal channel is a pattern that forms when price oscillates between a parallel horizontal swing high resistance level and a horizontal swing low support level in a sideways direction. A horizontal price channel requires a minimum of three swing high prices at the same price level and three swing low prices at the same support level. A horizontal channel is also referred to as a "trading channel" or a "sideways channel".
What's The Difference Between a Horizontal Channel vs Rectangle Pattern?
The horizontal price channel difference with a rectangle chart pattern is a horizontal channel requires a minimum of three swing high points and three swing low points while a rectangle pattern requires a minimum of two swing high peaks and two swing low troughs.
What Are The Components Of a Price Channel Pattern?
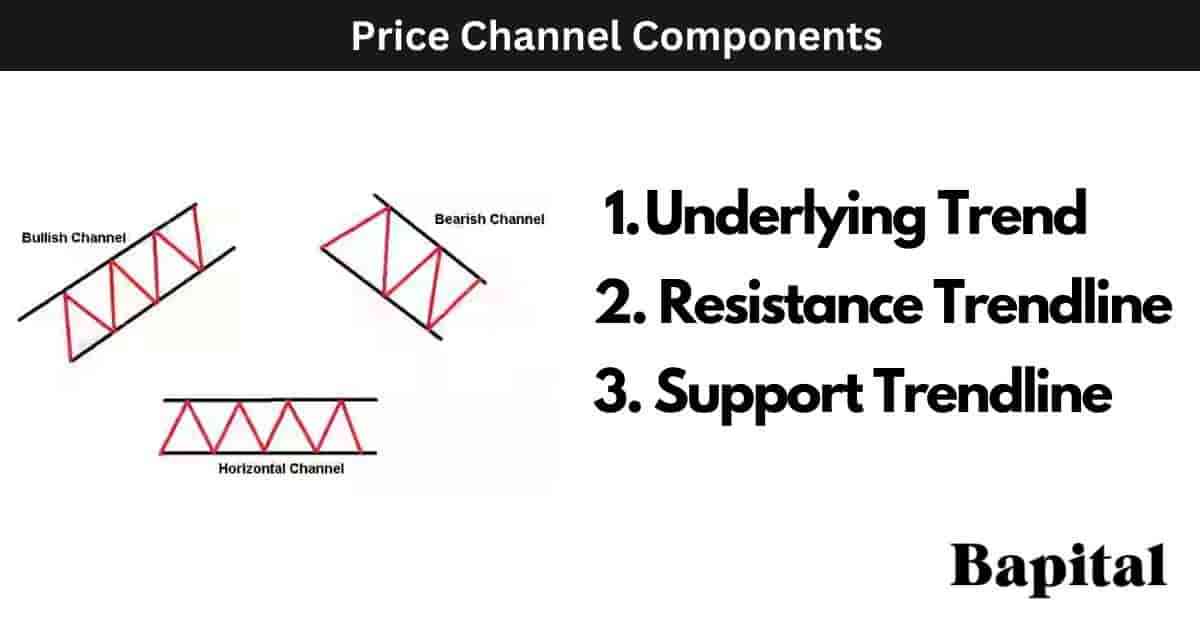
The three price channel pattern components are an underlying trend component, a resistance trendline component, and a support trendline component.
The three ascending channel pattern components are an underlying bullish price trend, a rising resistance trendline, and a rising support trendline.
The three descending channel pattern components are an underlying bearish price trend, a declining resistance trendline, and a declining support trendline.
The three horizontal channel pattern components are a sideways trend with no clear direction, a horizontal resistance trendline, and a horizontal support trendline.
How Do You Identify A Price Channel Pattern?
A price channel pattern is identified by its shape and clear price consolidation within a price range with a clear support area and a clear resistance area.
An ascending channel pattern is identified when a market price is moving upward in a bullish direction between two upward sloping parallel levels of support and resistance lines.
A descending channel pattern is identified when a market price is moving downward in a bearish direction between two downward sloping parallel levels of support and resistance lines.
A horizontal channel pattern is identified when a financial instrument price is moving sideways and rangebound between two horizontal parallel levels of support and resistance lines.
What Causes A Price Channel To Form?
A price channel is caused by to the interplay of market supply and demand forces. In an ascending channel, buyer demand at key support levels prevents prices from falling lower, leading to higher price lows and higher price highs. In a descending channel, selling pressure at resistance levels results in lower price highs and lower price lows. Market participants' reactions to established trends and psychological support and resistance levels, coupled with prevailing investor sentiment, contribute to the trading channel's formation.
How To Draw a Price Channel Pattern
An ascending channel drawing involves identifying rising market prices with clear swing high points and clear swing low points. Draw a rising trendline from left to right connecting the swing high prices together. Then, draw a rising support trendline connecting the swing low prices together. The pair of rising lines need to be parallel to each other and there needs to be at least three swing high price points and three swing low price points to complete the ascending channel drawing.
The descending channel drawing involves identifying falling market prices with clear lower swing low points and lower swing high points. Draw a downward sloping resistance line from left to right that connects the lower swing high points together. Then, draw a parallel downward sloping support line from left to right that connects the lower swing low points together. A minimum of three declining swing low resistance points and three declining swing low support points are needed to complete the descending channel drawing.
Horizontal channel drawing involves identifying rangebound market prices and price consolidations. Draw a horizontal resistance line from left to right that connects the swing high price points together. Then, draw a horizontal support line from left to right that connects the swing low price points together. A minimum of three swing high peaks and three swing low troughs are needed to complete the horizontal channel drawing.
How To Trade Price Channels
Price channel pattern trading steps are below.
- Identify the type of price channel that forms
- Buy at the channel support, short at the channel resistance
- Set channel price target level
- Set channel stop-loss level
1. Identify The Type of Price Channel Pattern
The price channel trading first step is to identify the type of price channel that forms. Ascending channels, descending channels, and horizontal channels have different trading requiremenets so a trader needs to understand which type of price pattern forms first before placing trades.
2. Buy At Channel Support, Short at Channel Resistance
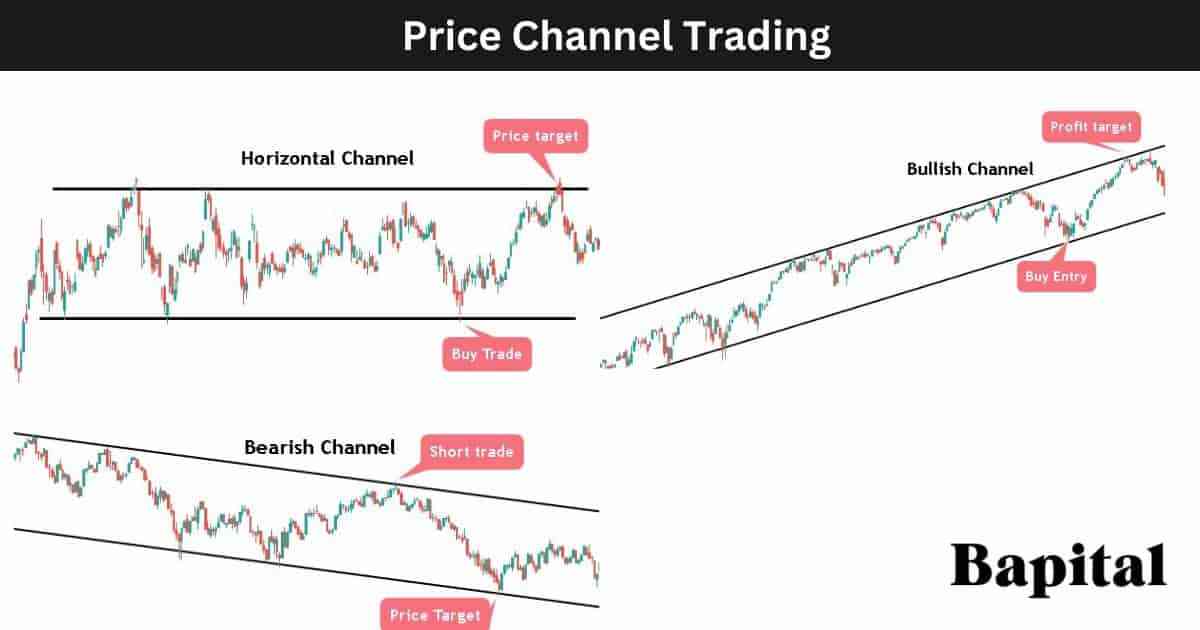
The price channel trading second step is to enter a trade position. Traders look for buy trade opportunities on ascending channels, short trade opportunities on descending channels, and both buy and sell trade opportunities on horizontal channels.
An ascending channel buy trade entry point is when the price reaches the rising support level within the channel range.
A descending channel short trade entry point is when the market price reaches the declining resistance level within the channel range.
A horizontal channel buy entry point is when the market price reaches the horizontal support level and the short entry point is when the market price touches the horizontal resistance level.
3. Set Channel Price Target
The price channel pattern trading third step is to set a price target for the trade.
An ascending channel pattern trading price target is set by marking the upward sloping resistance level and placing a profit target order at this price level.
A descending channel pattern trading price target is set by marking the downward sloping support level and placing a profit target order at this support price level.
A horizontal channel pattern trading price target is set at the horizontal resistance point on a buy trade and the horizontal support point on a short trade.
4. Set Channel Stop-Loss Level
The price channel trading fourth step is to set a stop-loss order to manage trade risk.
An ascending channel stop-loss order is placed directly underneath the support level trendline.
A descending channel stop-loss order is placed directly above the resistance level trendline.
A horizontal channel stop-loss order is placed directly below the horizontal support level on a long trade position and it is placed directly above the horizontal resistance level on a shorting trade.
What Is a Price Channel Pattern Trading Strategy?
A price channel pattern trading strategy is the ascending channel breakout strategy which involves scanning U.S. market securities for stocks up 5% or more on daily trade volume over 1 million shares. Identify the stocks with ascending channel formations and wait for the price to penetrate the resistance point on volume. Enter a long trade position as the price breakout occurs. Put a 10 exponential moving average (EMA) overlay on the market chart and use a trailing stop-loss order to trail along the 10EMA. When the price closes below the 10EMA, close the trade position.
What Are The Price Channel Pattern Trading Rules?
The price channel trading rules are listed below.
- Risk 1% of trading capital total
- Enter a buy trade or short trade at the channel support point and resistance point only
- Avoid trading before or during important market news events
- Know the entry price, stop loss price, and exit price prior to trade entry
- Do not chase price
- Avoid illiquid markets with low volume
What Are The Common Mistakes When Trading the Price Channel Pattern?
The price channel pattern trading mistakes are ignoring volatile market conditions that can make it harder to trade the channel, ignoring volume which can act as a confirming signal, chasing price action which means getting poor trade entries, and misinterpreting channel breakouts.
What Are Price Channel Pattern Examples?
Price channel pattern historical examples are below.
Ascending Channel Pattern Example
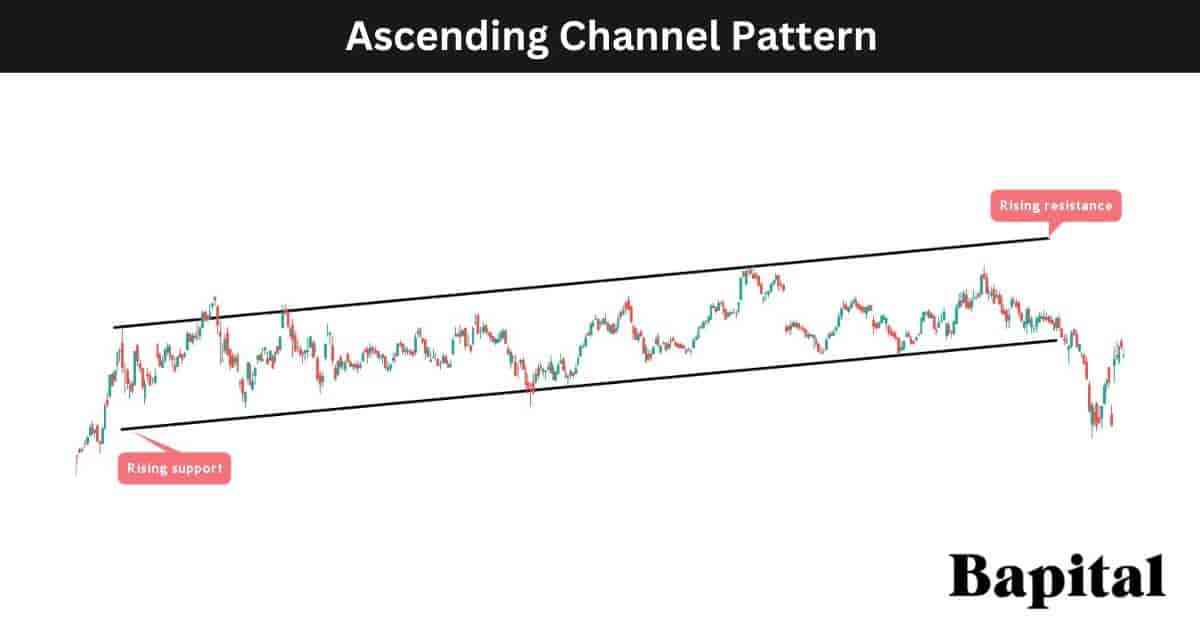
An ascending channel stock market example is illustrated on the daily Amazon (AMZN) stock price chart above. The stock price rises in a bullish trend in a bullish range between a rising suport level and rising resistance level.
Descending Channel Pattern Example
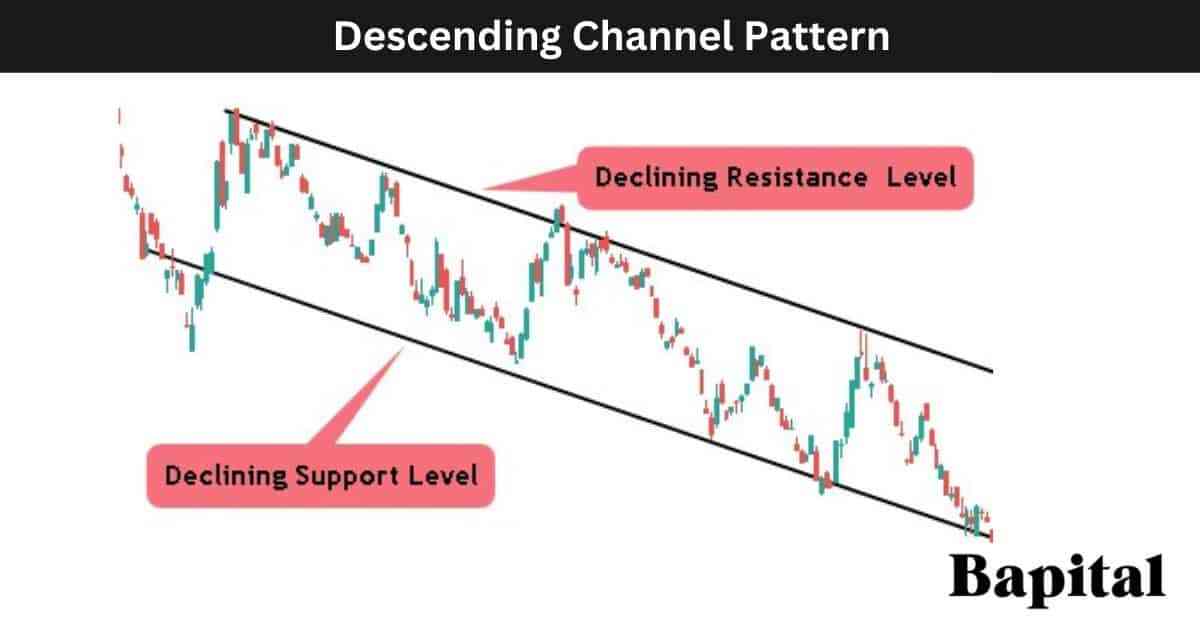
A descending channel pattern forex market example is displayed on the weekly EUR/USD price chart above. The forex price falls in a bearish trend within a bearish range beween a falling resistance level and a falling support level.
Horizontal Channel Pattern Example
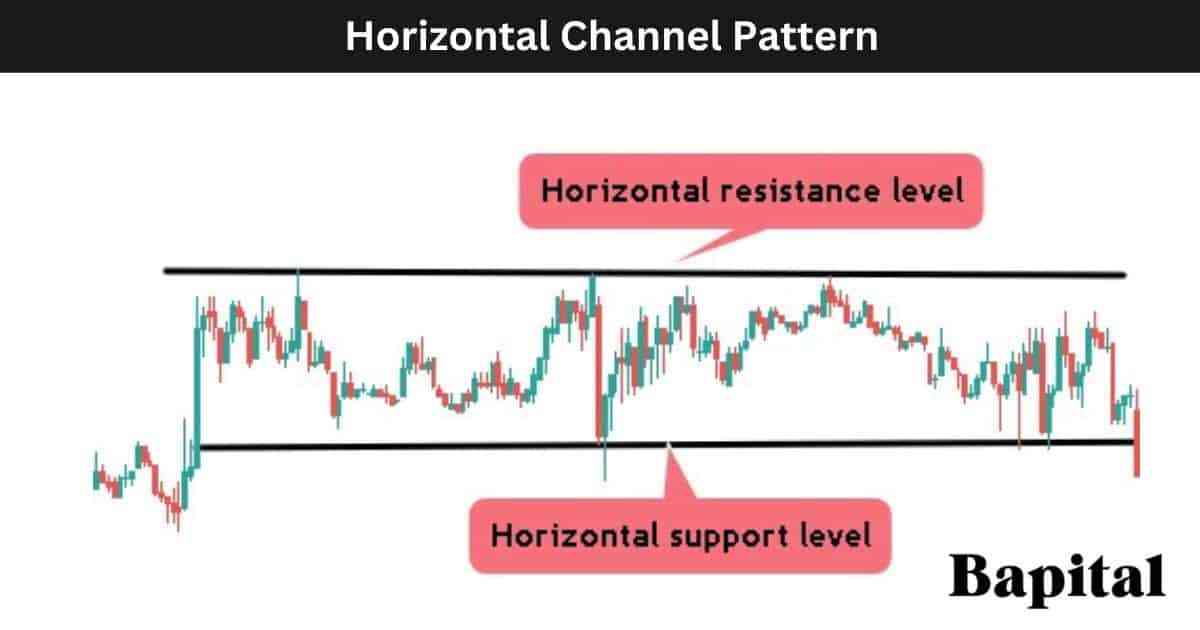
A horizontal channel pattern futures market example is shown on the 15-minute price chart of Soybeans futures above. The futures price is rangebound and moving sideways between the lower support level and higher resistance level.
What Are the Benefits Of Price Channels?
The price channel pattern benefits are below.
- Helps provide logic to the price action: Understand that the price is trading within a price channel can help provide logic and understanding to the price action in the market.
- Helps a trader manage risk: A price channel pattern can help a trader find a low-risk entry point into a market.
- Helps catch bullish price trends: Bullish and bearish channel patterns can help traders catch a price trend from a low-risk entry point.
- Easy to learn: New traders can easily learn how to find and draw price channel patterns.
- Assists with setting price targets in trades: A price channel pattern can help assist with finding price targets for trades as a price channel has areas of resistance and support.
What Are the Limitations Of Price Channels?
The price channel pattern limitations are below.
- Hard to get exact price entries: Buying the support level and shorting the resistance levels of the channel can be tough as the price can trade through these price levels often before a price bounce or price retracement
- False signals: The channel pattern can fail and generate false signals as traders attempt to buy support levels or short resistance levels
- Does not work during high volatility price action periods: Higher price volatility renders the price channels less effective to trade with many fakeouts and hard to understand price action
What Technical Indicators Are Used With Price Channels?
Price channel patterns are used with technical trading indicators like the R.S.I. oscillator, volume indicator, volume weighted average price (VWAP), moving average, keltner channels, bollinger bands, average true range, average daily range, and the moving average convergence divergence (MACD).
What Is The Most Popular Technical Indicator Used With Price Channels?
The price channel pattern most popular indicator used is the volume indicator which acts as a confirmation signal as price breaks down or price breaks out from the channel pattern.
What Is The Least Popular Technical Indicator Used With Price Channels?
The price channel pattern least popular indicator used is the ichimoku cloud indicator as it causes confusion and a lack of price action clarity.
What Is The Psychology Behind the Price Channel Pattern?
The price channel pattern psychology is rooted in traders collective behavior, sentiment, and reactions to established trends.
The ascending channel psychology involves buyers expressing confidence as the price rises, believing that the upward price trajectory will continue. This positive sentiment is expressed through higher swing low prices on a chart.
The descending channnel psychology involves sellers dominating, reflecting in a bearish outlook which is expressed through lower swing high prices in the pattern. Traders have a bearish, negative sentiment during a descending channel.
The horizontal channel psychology involves trader confusion with no clear trend direction. Price flucuatates and pulls back within a narrow range with no dominate positive or negative sentiment in the market where the pattern forms.
What Are Price Channel Pattern Statistics?
Price channel pattern statistics are illustrated in the statistics table below. All price channel pattern statistical data has been calculated by backtesting historical data of financial markets.
Price Channel Pattern Frequently Asked Questions
Below are frequently asked questions about the price channel chart pattern.
Is a Price Channel Pattern Bullish Or Bearish?
A price channel pattern can be either bullish or bearish depending on the type of price channel pattern that forms with an ascending channel being a bullish signal and a descending channel being a bearish signal.
Is a Price Channel Pattern a Continuation or Reversal Pattern?
A price channel is a continuation chart pattern that signals that the trend of the price will continue in the same direction until the price breaks out of the channel.
What Are Other Continuation Patterns?
Alternative continuation patterns are listed below.
What Does a Channel Pattern Tell You?
A price channel chart pattern illustrates that the price action is in an orderly fashion between clearly defined support and resistance levels and that the trend direction will continue until the price breaks out or breaks down from the channel.
What Type Of Price Charts Do Price Channel Patterns Form On?
Price channel patterns form on line charts, candlestick charts, bar charts, area charts, and point and figure charts.
What Timeframes Can a Price Channel Pattern Form On?
A price chart pattern can form on any timeframe price chart from as low as a tick charts up to yearly price charts.
The most popular channel pattern timeframes to trade are the 1-minute price chart, the 30-minute price chart, the hourly price chart and the daily price chart. The least popular price channel pattern timeframe to trade is the monthly price chart and the yearly timeframe.
How Long Does a Price Channel Take To Form?
A price channel pattern formation timeframe ranges from 3 weeks to 20 weeks on a daily price chart and 15 weeks to 100 weeks on a weekly price chart.
How Often Does a Price Channel Form?
A price channel pattern forms 5 to 7 times per year on a daily price chart. It forms 30 to 50 times per year on an hourly price chart and it forms 1 to 2 times per year on a weekly price chart.
What Type Of Traders Trade Price Channels?
A price channel pattern is used by scalpers, day traders, swing traders, position traders, long-term traders, professional technical analysts, and active investors.
How Do Traders Find Price Channels?
Price channel pattern formations are found by scanning the financial markets with a channel charting scanner, checking the online profiles of top traders or expert chartered market technicians (CMT), browsing the market charts manually, or by checking trading/investment broker software.
What Are Books To Learn About Price Channels?
The price channel pattern books to learn from are "Technical Analysis of Financial Markets" by John Murphy and "Getting Started In Chart Patterns" by Thomas Bulkowski.
What Are Price Channel Pattern Alternatives?
Price channel pattern alternatives are the rectangle pattern, the rising wedge pattern and the falling wedge pattern.
