What Is an Inverse Head and Shoulders Pattern?
An inverse head and shoulders patterns is a bullish pattern that signals a price reversal from a bearish downtrend to a bullish uptrend. An inverse head and shoulders pattern is a reversal pattern, forming at the end of a bearish trend. An inverse head and shoulders formation gets its name as it resembles an inverted head with two shoulders shape. An inverse head and shoulders pattern is also known as a "head and shoulders bottom" or a "reverse head and shoulders" and it is a bullish signal.
Inverse Head And Shoulders Pattern Components
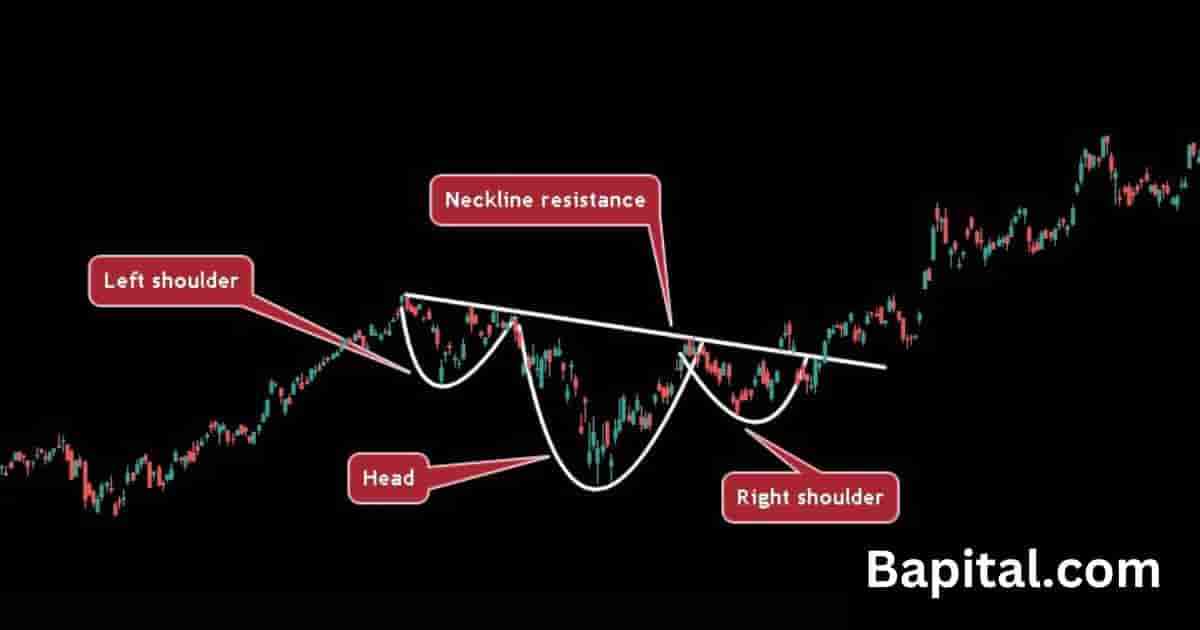
The inverse head and shoulders pattern components are below.
- Inverted Left Shoulder: This is the left-hand side shoulder component of the inverse head and shoulder and it is shaped like a small "u" shape. It is the first componenet to form in the inverse head and shoulders pattern formation process
- Inverted Head: This is the middle part of the pattern and it is shaped like a larger "U" shape relative to the shoulders. The head is the second component to form in this pattern's formation process
- Inverted Right Shoulder: This is the right-hand side shoulder component of the pattern and it is shaped like a small "u" shape. The inverted right shoulder is similar in height to the inverted left shoulder. The inverted right shoulder component is the third component to form in the pattern's formation process
- Neckline Resistance Level: The pattern neckline is the resistance trendline that connects the swing high prices together. The neckline resistance line can be horizontal, slanted upward or slanted downward. The resistance neckline level is the fourth component to form in the pattern's development process
- Price Breakout: The inverse head and shoulder pattern breakout price is when the price penetrates above the neckline resistance trendline. This is the pattern's fifth component to form and is the long entry point breakout level
Understand these 5 components helps traders identify an inverse head and shoulders in all global markets.
Inverse Head and Shoulder Pattern Causes
An inverse head and shoulders pattern is caused by shifts in market dynamics and the interplay between buyers and sellers. The inverted left shoulder is caused by the price declining and reaching a temporary swing low price, followed by a price rebound.
The subsequent decline, forming the inverted head, represents a further price dip to a lower swing low price. This often sparks increased selling pressure. The inverted right shoulder is caused by the asset price making another upward move, signaling that buyer strength is present and a bearish-to-bullish trend reversal is beginning.
How To Trade an Inverse Head and Shoulders Pattern
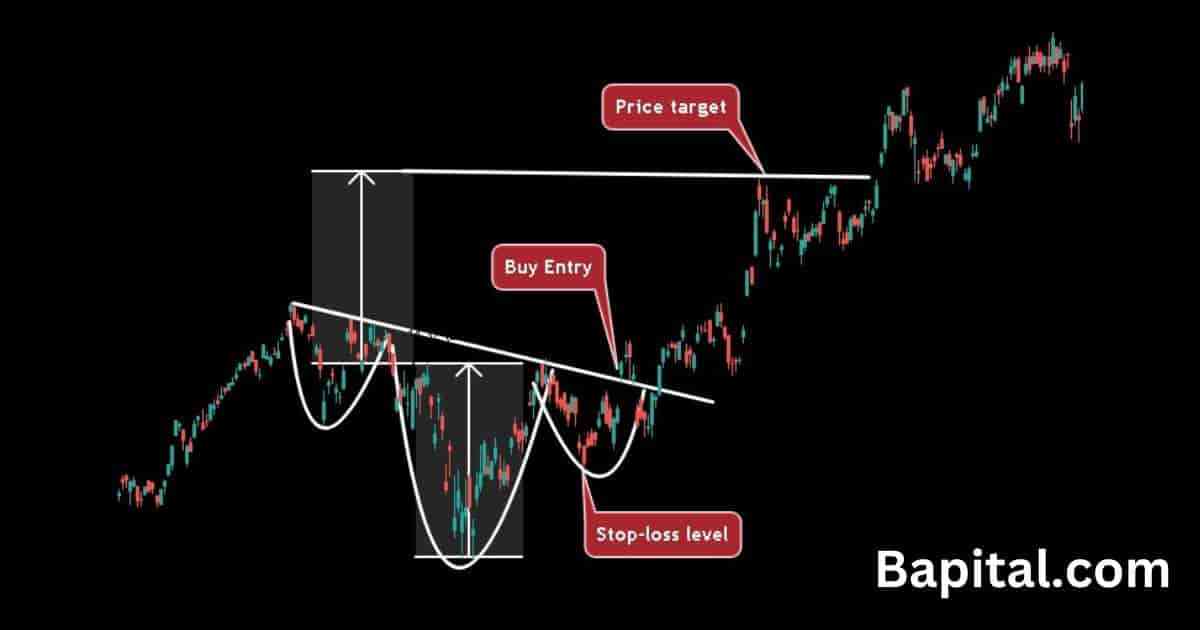
The inverse head and shoulders pattern trading steps are below.
- Enter a buy trade when the price breaks above the pattern's resistance area
- Set a price target by calculating the inverse head component's height from low price to high price and add this calculation to the buy entry point
- Place a stop-loss order below the inverse right shoulder swing low level
- Set the trade position size risk level to 1% of trading capital
- Ensure the reward/risk ratio is 2 to 1 at a minimum, i.e. reward $2+ for every $1 risked
Inverse Head and Shoulders Entry Point
The inverse head and shoulders pattern entry price is set when the price penetrates the resistance trendline of the pattern. This is the long entry price trigger for the trade. Watch for increasing buying volume and bullish momentum as the price increases above the neckline resistance level.
Inverse Head and Shoulders Price Target
An inverted head and shoulders pattern price target is set by measuring the height of inverted head between the swing price low trough and swing price high peak of the head and adding this height measurement to the buy price.
For example, if the buying entry price is $200 and the inverse head height is $30, the profit target is $230 ($200 + $30).
Inverse Head and Shoulder Price Target Formula
The inverse head and shoulder price target calculation formula is: Inverse Head & Shoulders Price Target = Buy Entry Price + Inverse Head Height.
Inverse Head and Shoulders Risk Management
An inverse head and shoulder pattern risk management is set by placing a stop loss below the swing low price of the inverted right shoulder low price. Traders use 1% trading capital risk when trading inverted head and shoulders patterns. A stop-loss orders helps protect against a bearish price breakdown, price fakeouts, and high volatility markets.
An inverse head and shoulders pattern risk/reward ratio is 1:2 (risk $1 to reward $2+).
Inverse Head and Shoulders Trading Strategy
An inverse head and shoulders trading strategy is to scan the daily stock financial market charts for bearish price trends of -15% or more. Wait for the pattern to form. Put a 20 exponential moving average (EMA) overlay on the chart. Enter a buying position when the price rises above the resistance neckline point on increased buyer volume (green bars).
Set a trailing stop-loss order along the 20EMA. When the candlestick price bar closes below the 20EMA, close the trading position. Set the position sizing to 1% of trading capital on the initial buy entry. Do not apply this strategy during market news events.
The inverse head and shoulders pattern can be adjusted in timeframe to suit scalping trading strategies, day trading strategies, swing trading strategies, and long term investing strategies.
Inverse Head and Shoulders Pattern Trading Rules
The inverse head and shoulders pattern trading rules are listed below.
- Risk a maximum 1% of trading capital
- Enter a buy trade position when price breaks resistance level only
- Know the exit price, entry price, and stop loss price prior to trading
- Watch the volume indicator for increased buying volume at the price breakout level
- Calculate the trade position size prior to trading
- Avoid trading prior to or during important market news announcements
Inverse Head and Shoulders Pattern Examples
Inverse head and shoulders chart pattern examples are illustrated below.
Inverse Head and Shoulders Stock Example
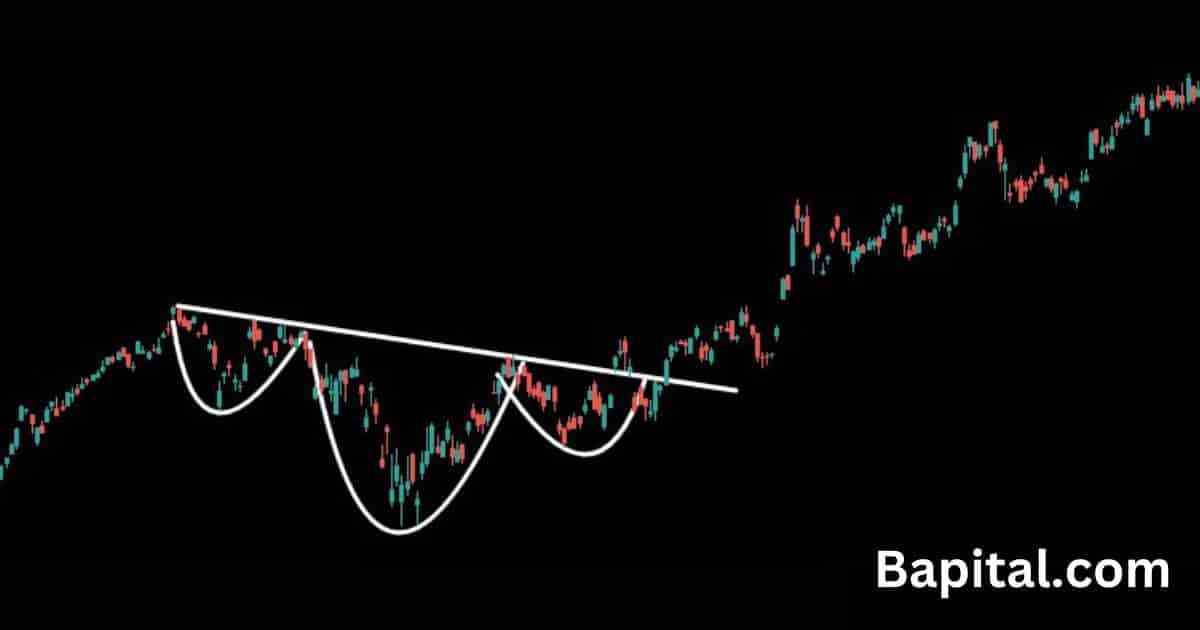
An inverse head and shoulders pattern stock example is shown on the daily stock chart of Alibaba stock (BABA) above. The stock price forms an inverse head and shoulders after a price consolidation period. Alibaba price moves higher and breaks out above the neckline area before trending in a bullish direction to the trade exit level.
Inverse Head and Shoulders Forex Example
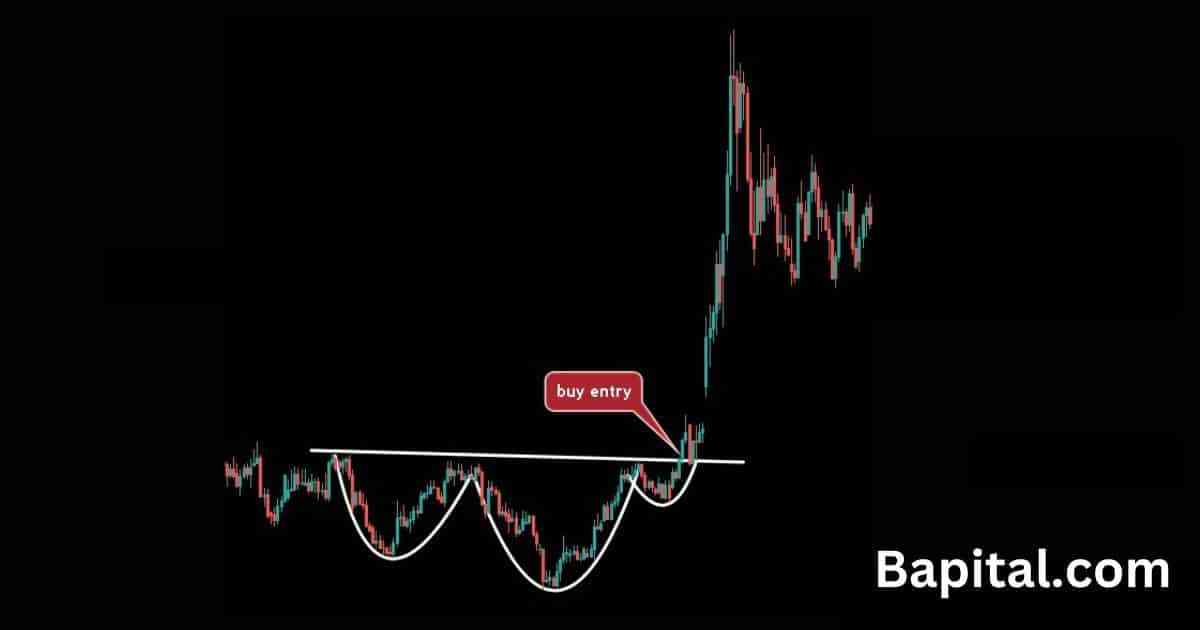
An inverse head and shoulders pattern forex example is displayed on the hourly currency chart of USD/CAD above. The currency price forms an inverted head and shoulders pattern before breaking out and moving higher in an upward direction to the trade exit point.
Inverse Head and Shoulders Short Timeframe Example
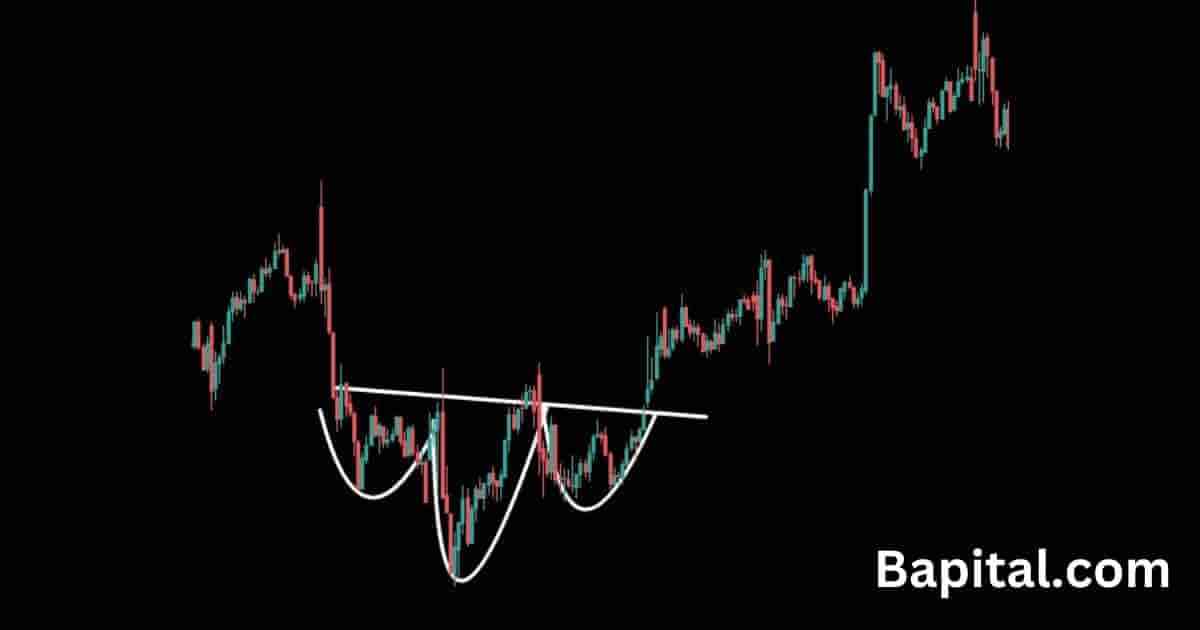
An inverse head and shoulders pattern short timeframe example is illustrated on the 5-minute Amazon stock (AMZN) chart above.
After a 30 minute bearish downswing in the stock price, the pattern starts to develope over a 3 day period. The equity price rises above the neckline and sharply moves higher to the profit taking level resulting in the pattern completion.
Inverse Head and Shoulders Long Timeframe Example
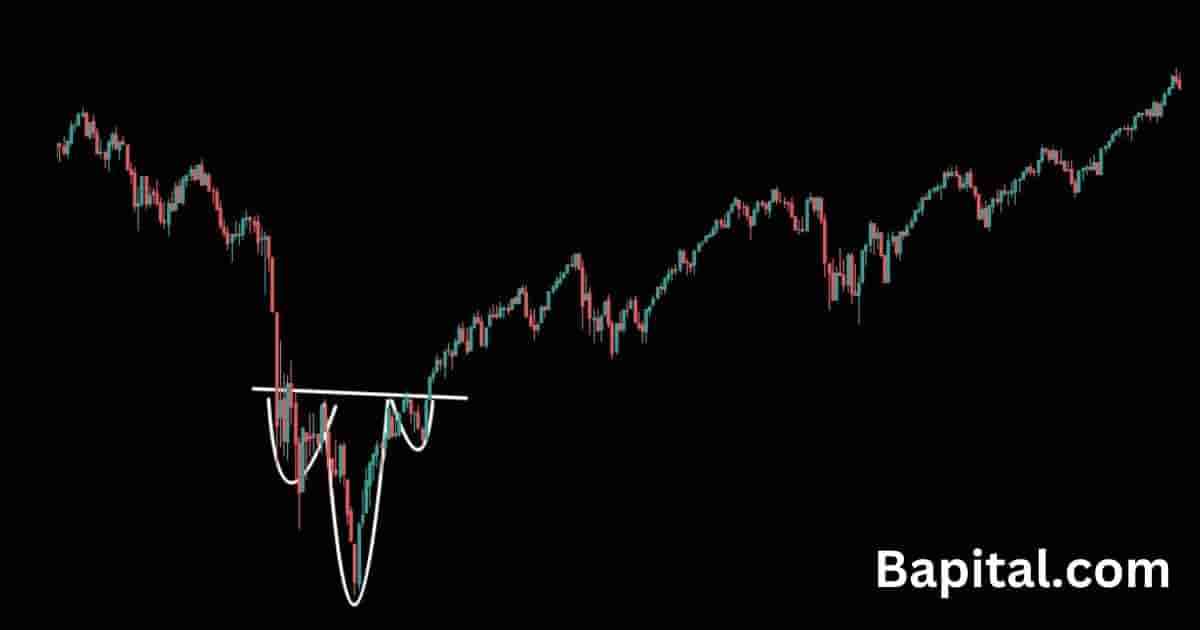
An inverse head and shoulders pattern long timeframe example is highlighted on the weekly price chart of the S&P500 index. The index price was in steep decline in a bearish trend for 5 months before bottoming out and forming an inverse head and shoulders pattern.
The S&P500 price sharply increases and penetrates through the downward sloping resistance neckline before rallying higher to the target price level, thus completing the pattern formation.
Inverse Head and Shoulders Pattern Failure
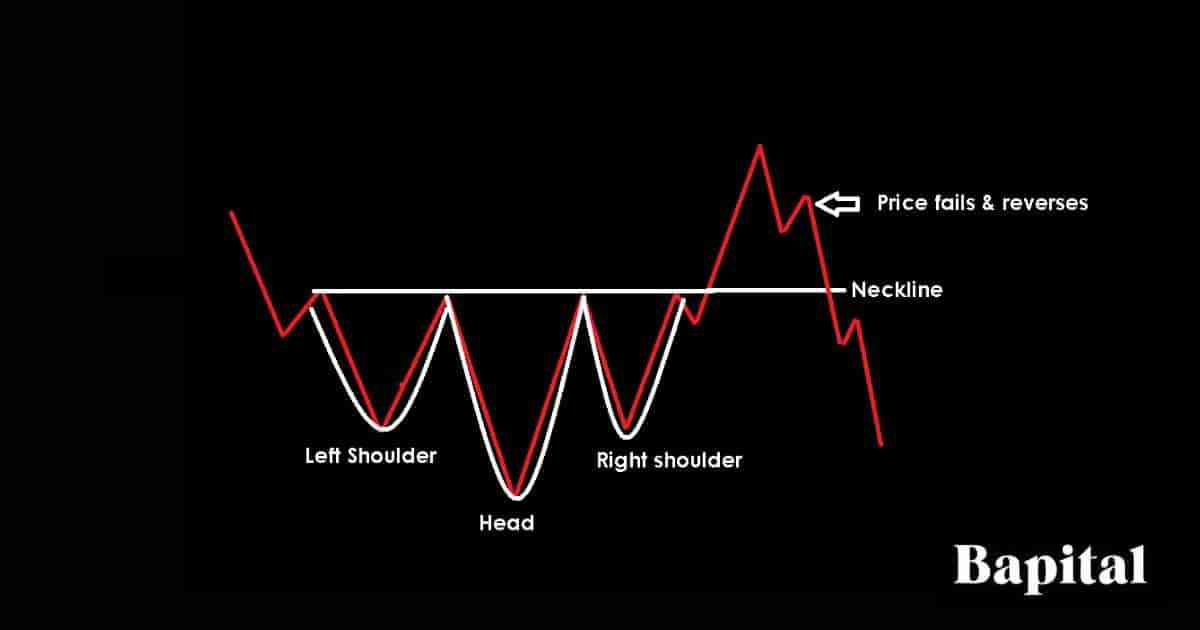
An inverse head and shoulders pattern failure, also known as a "head and shoulders bottom failure", is when a head and shoulders pattern forms but fails to continue higher in price. The head and shoulder pattern is invalidated and fails when the market price breaks out above the breakout entry price in a bullish movement but reverses from above the resistance point to trend lower below the pattern's inverted right shoulder in a bearish direction. A failed inverse head and shoulders pattern is a bearish signal.
Inverse Head and Shoulder Pattern Failure Causes
The inverse head and shoulders pattern failure causes are below.
- Low Buying Volume: A lack of buying volume after a market breakout can cause the inverse head and shoulders pattern to fail. If there are few buyers after the market price rises, this can be an indication that traders are not confident in the market trending higher and instead believe there will be a failure to continue higher after the price breakout
- Bearish Market News: Bearish financial market news can cause a price reversal from a bullish to bearish downtrend and result in a failed pattern
- High Volatility: Highly volatile markets with prices fluctuating in large ranges can cause the pattern to fail
Inverse Head and Shoulders Pattern Benefits
Inverse head and shoulders pattern benefits are below.
- Helps Traders Find Bullish Price Reversals: An inverse head and shoulders can help a trader find a price reversal from bearish price action to bullish price action
- Provides Logic and Understanding to the Price Action: An inverse head and shoulders pattern can help new traders logically understand the market conditions in a financial market
- Helps Traders Catch Large Bullish Price Moves: An inverse head and shoulders pattern can help a trader catch new bullish price trends and price rallies early
- Works In All Markets: The inverse head and shoulders pattern can be applied to any capital market including futures, options, stocks, bonds, forex, indices, ETFs, commodities, and cryptocurrencies
- Works On All Timeframes: The inverse head and shoulders pattern can be applied in all timeframes from 1-second charts up to yearly price charts
Inverse Head and Shoulders Pattern Limitations
Inverse head and shoulders pattern limitations are listed below.
- False Signals: Not all inverted head and shoulders patterns lead to bullish trend reversals. Some may fail, resulting in false breakouts. Traders should be cautious and use additional technical analysis indicators to confirm the pattern's validity
- Subjectivity: Like other chart patterns, the inverted head and shoulders chart pattern is somewhat subjective, and different traders may interpret it differently. There can be variations in the size and shape of the pattern which may lead to confusion for novice traders
Inverse Head and Shoulders Pattern Psychology
The inverse head and shoulders pattern psychology starts from a downtrend, beginning with an inverted left shoulder representing a period of price decline, reflecting market participant pessimism.
The formation of the inverted head marks a market bottom, often indicative of heavy selling reaching a climax with peak negativity. The inverted right shoulder follows, characterized by a rise as buyers cautiously re-enter the market, signaling a shift in sentiment from extreme negativity to cautious optimism.
Pattern completions occurs when the price breaks above the neckline and this breakout is seen as a bullish confirmation, suggesting a change in the prevailing trend and prompting further buying interest and increased positive sentiment.
Inverse Head and Shoulders Pattern Frequently Asked Questions
Below are frequently asked questions about the inverse head and shoulders chart pattern.
How Accurate Are Inverse Head and Shoulder Patterns?
An inverse head and shoulders pattern win rate is 46% from our backtesting data of 1,211 of these chart pattern formations.
What Are Alternative Names For an Inverse Head and Shoulders Pattern?
Inverse head and shoulders pattern alternative names are a "head and shoulders bottom", an "inverted head and shoulders pattern", or a "reverse head and shoulders pattern".
What Is The Opposite Of an Inverse Head and Shoulders Pattern?
The opposite of a bullish inverse head and shoulders pattern (head and shoulder bottom) is a bearish head and shoulders pattern (head and shoulders top).
Is an Inverse Head and Shoulders Pattern A Bullish Or Bearish Signal?
An inverse head and shoulders is a bullish signal that indicates financial market prices will rally and become bullish after the price breaks out from the pattern.
What Timeframe Price Charts Do Inverse Head and Shoulder Patterns Form On?
Inverse head and shoulder patterns form on any timeframe price chart from short term tick charts to longer-term monthly price charts and yearly price charts.
How Long Does an Inverse Head and Shoulders Pattern Take To Form?
Inverse head and shoulders pattern formation time is 65+ minutes on a 1-minute price chart to 65+ years on a yearly price chart. To calculate the inverse head and shoulder formation time, multiple the chart timeframe used by 65. For example, a 15-minute timeframe price chart means an inverse head and shoulders pattern will take a minimum of 16.25 hours (15 minutes x 65) to form.
What Technical Indicators Are Used With The Inverse Head and Shoulders Pattern?
Inverse head and shoulder patterrns are used with the volume indicator, moving averages overlay, R.S.I., volume profile, and pivot points.
What Type Of Traders Use Inverse Head and Shoulders Patterns?
An inverse head and shoulders pattern is used by scalpers, day traders, swing traders, position traders, and active investors.
How Do Traders Find Inverse Head and Shoulder Patterns?
An inverse head and shoulders pattern is found by scanning the price charts of financial markets manually, using a pattern charting screener, or by browsing the online feeds of expert technical analysts.
What Are Alternative Bullish Reversal Patterns?
Inverse head and shoulders alternative bullish reversal patterns are listed below.
