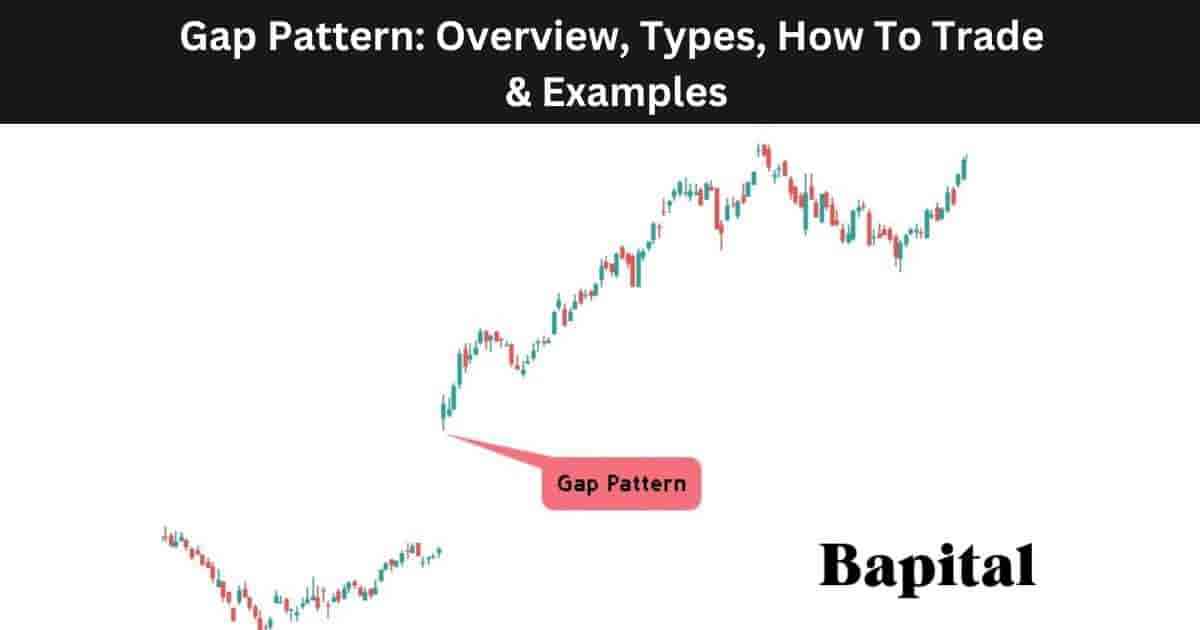
What Is a Gap Pattern in Technical Analysis?
A gap pattern is a pattern in technical analysis that forms on a price chart when there is a gap or space between two consecutive trading periods. A gap occurs when the opening price of one trading session is different from the closing price of the previous trading session, resulting in a visible gap on the price chart. A price gap can be in an upward direction which is called a gap up or in a downward direction which is called a gap down.
What Is a Gap Up Pattern?
A gap up is a pattern that refers to an upward price gap where the opening price of a financial instrument is higher than the closing price of the previous trading session. This pattern typically suggests a bullish sentiment and may indicate positive news or increased buying interest.
What Is a Full Gap Up?
A full gap up is when the market's opening price is higher than the previous day's highest price.
What Is a Partial Gap Up?
A partial gap up is when the market opening price is above the prior closing price but not above the previous day's high price.
What Is a Gap Down Pattern?
A gap down is a patten that refers to a downward price gap where the opening price of a financial instrument is lower than the closing price of the previous trading session. This pattern typically suggests a bearish sentiment and may indicate negative news or increased selling interest.
What Is a Full Gap Down?
A full gap down is when the market's opening price is lower than the previous day's lowest price.
What Is a Partial Gap Down?
A partial gap down is when the market opening price is below the prior closing price but not lower than the previous day's low price.
What Are The Types of Gap Patterns?
The 5 gap pattern types are common gaps, exhaustion gaps, breakaway gaps, island gaps, and continuation gaps.
1. Continuation Gap
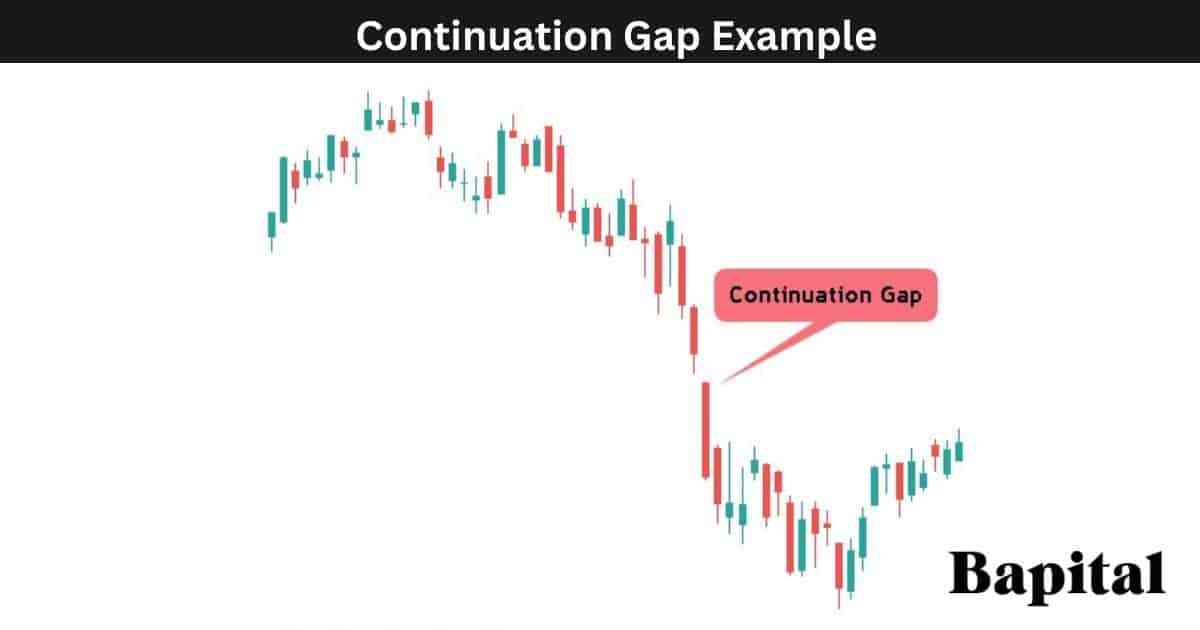
A continuation gap is a price gap that leads to a price trend continuation in the same direction as the gap. A continuation gap up indicates a bullish trend continuation and a continuation gap down indicates a bearish trend continuation. A continuation gap forms in the middle of an already established price trend and are normally caused by earning releases in stocks. A continuation gap is not typically filled in which means market prices will not move to fill in the price gap between the opening price and the previous closing price. A continuation gap pattern is also known as a "runaway gap".
What Is a Continuation Gap Example?
A continuation gap example is illustrated on the price chart below.
2. Exhaustion Gap
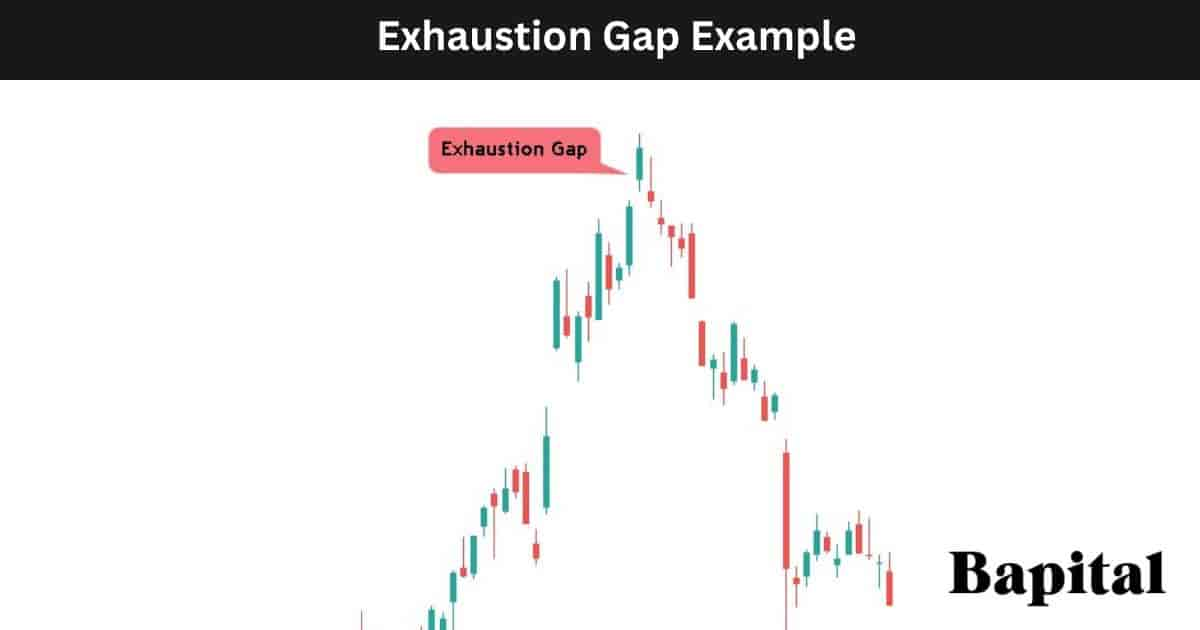
An exhaustion gap is a price gap that leads to an exhaustion in a market price and a price reversal. An exhaustion gap up is a bearish reversal signal and an exhaustion gap down is a bullish reversal signal. Exhaustion gaps form at market tops and market bottoms and indicate a trend reversal. An exhaustion gap typically results in a gap fill which means market prices will move to fill in the price gap.
What Is an Exhaustion Gap Example?
An exhaustion gap example is displayed on the price chart below.
3. Breakaway Gap
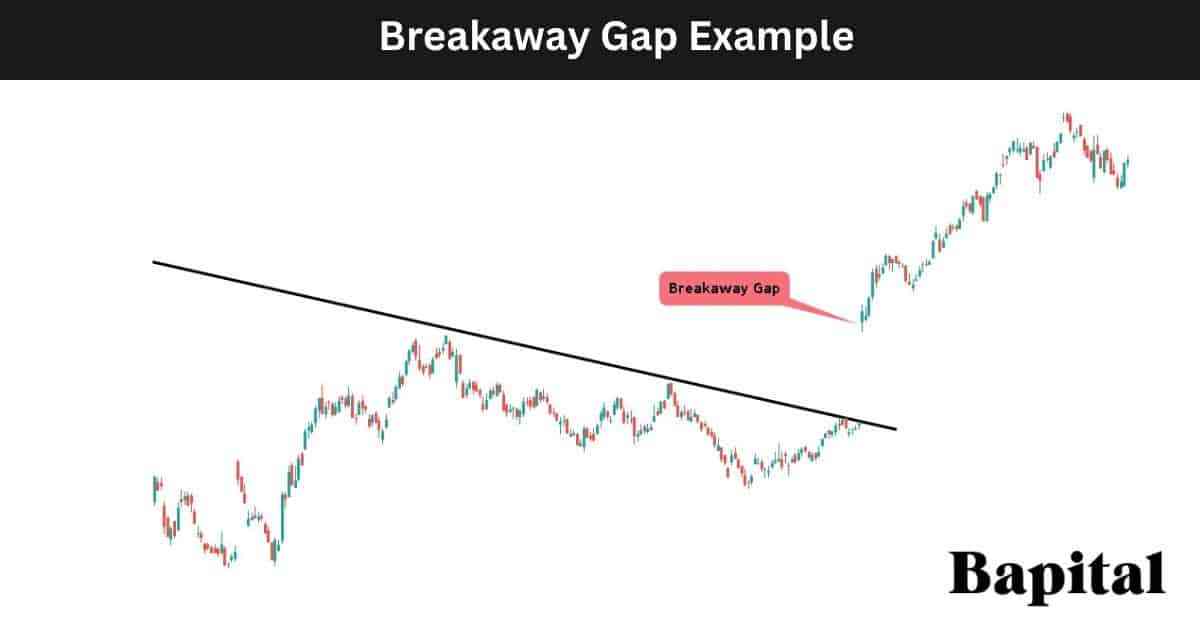
A breakaway gap is a price gap that forms on a financial market price chart at a chart pattern breakout level of resistance or support. A breakout gap pattern forms after a price consolidation period. A breakaway gap up is a bullish signal and a breakaway gap down is a bearish signal. A breakaway gap is not typically filled in which means market prices will not move to fill in the price gap between the opening price and the previous closing price.
What Is a Breakaway Gap Example?
A breakaway gap example is shown on the price chart below.
4. Common Gap
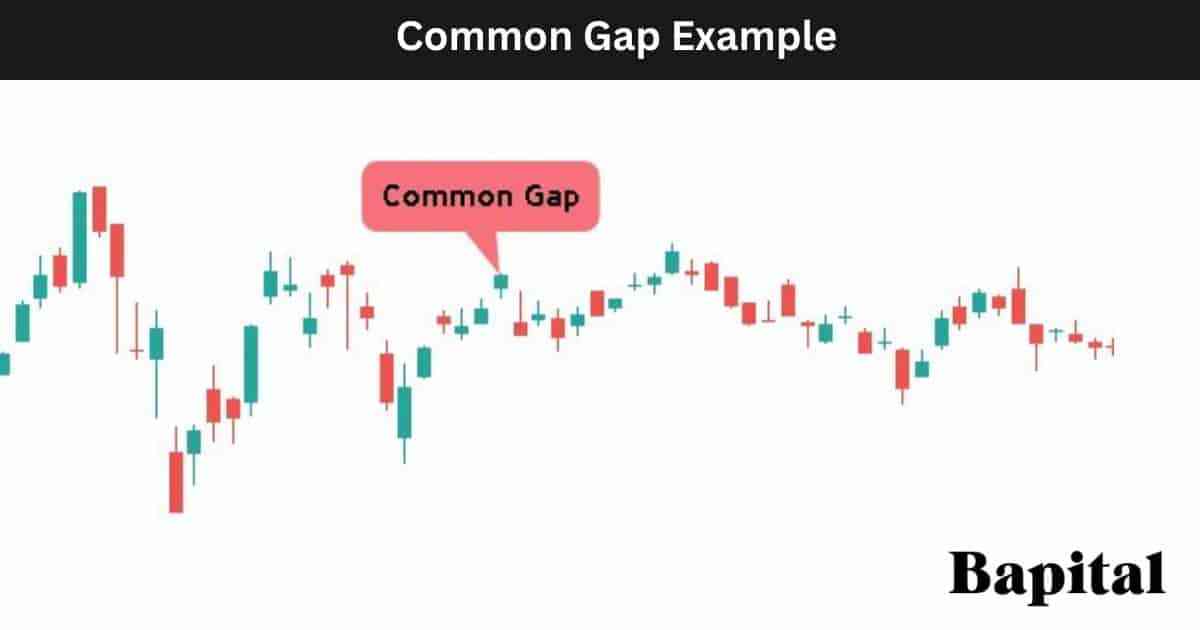
A common gap is a price gap that occurrs randomly on a price chart without any trends, news announcements or price breakouts before them. As the name suggests, they are common, especially in the stock market and occur without any specific reason or explanation. A common gap typically results in a gap fill which means market prices will move to fill in the price gap.
What Is a Common Gap Example?
A common gap example is displayed on the price chart below.
5. Island Gap
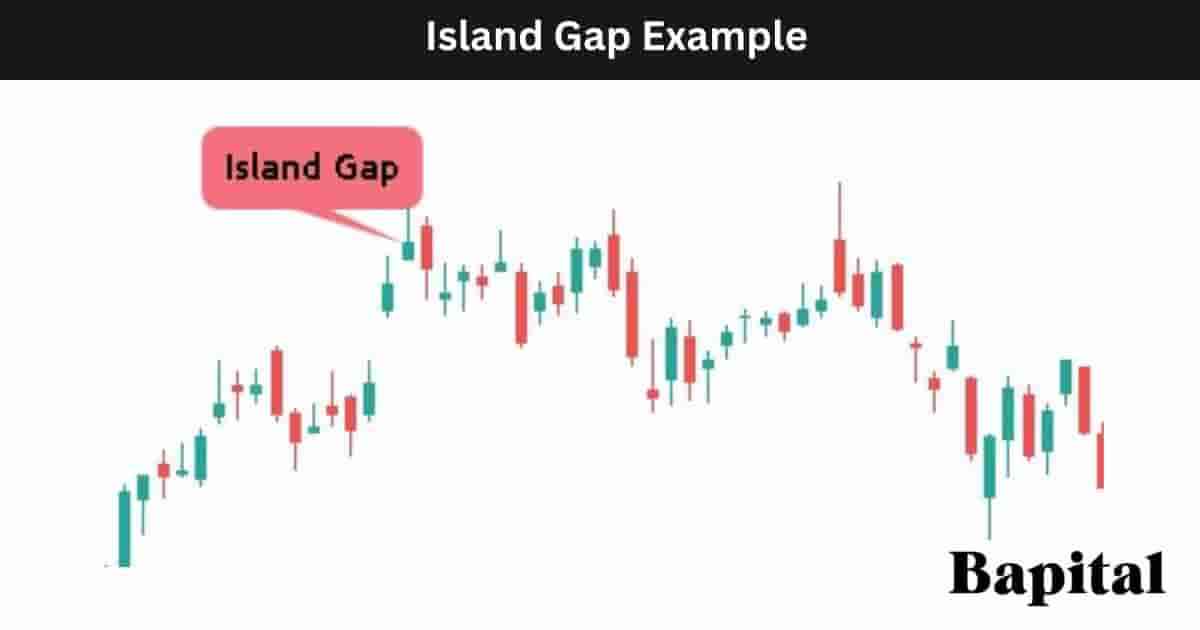
An island gap pattern is a pattern that occurs on a price chart and is characterized by a series of gaps, isolating a group of price bars, creating an "island" of prices. The island gap pattern is considered a reversal pattern and is an indication of a potential change in the prevailing trend. an island gap up is a bearish reversal pattern and an island gap down is a bullish reversal signal. An island gap is also referred to as an "island reversal.
What Is an Island Gap Example?
An island gap example is illustrated below.
What Are The Most Popular Types Of Gap Patterns?
The most popular gap pattern types are the breakaway gaps and the continuation gaps as these patterns lead to large market price trend movements with bullish upward momentum or bearish downward momentum.
What Is The Least Popular Type Of Gap Pattern?
The least popular type of gap pattern is the common gap pattern as traders rarely trade these patterns as there is no trading edge or higher probability trading setup with this gap pattern type.
How Do You Identify a Gap Pattern?
A gap pattern is identified by a change in price between the previous trading session closing price and the current trading session opening price.
A gap up pattern is identified by a bullish change in price between the previous trading session closing price and the current trading session opening price with the current opening price being higher than the prior closing price.
A gap down pattern is identified by a bearish change in price between the previous trading session closing price and the current trading session opening price with the current opening price being lower than the prior closing price.
What Causes a Gap Pattern To Form?
The causes of a gap pattern are listed below.
- News events: Economic, corporate or political news announcements can cause price gaps to form between trading sessions with an influx of buyers or sellers reacting to the news causing significant price movements
- Pre-market/afterhours volatility: Pre market and post market trading volatility can cause price spikes and an up gap or down gap when the market opens to retail traders
- Low liquidity: A market with low liquidity means a small market participant can cause a gap in price with very little trading volume as there are fewer trades and liquidity to absorb market orders. Market price gaps caused by low liquidity are known as "liquidity gaps"
- Market manipulation: Market manipulation like pump and dump schemes whereby manipulators artificially inflate the price of a security by spreading positive information and encouraging buying can cause price gaps to form
- Order spoofing: Order spoofing which involves placing large orders with no intention of executing them creates the false impression of demand and it can cause a price gap to form in the market
Are There Specific Events Or News That Cause Price Gaps?
Yes, specific events and news that commonly cause price gaps to form are earnings reports, merger and acquisitions, corporate restructuring, economic data releases like GDP numbers and employment rates, geopolitical events like trade wars and trade agreements, central bank announcements, and market rumors.
What Markets Do Gap Patterns Form In?
Gap patterns form in all global markets including stocks, bonds, forex, cryptocurrencies, ETFs, indices, futures, options, and commodities.
How Do You Find Gap Patterns In Markets?
Gap pattern formations are found in markets by scanning the financial markets with a gap up/gap down charting scanner, checking the online profiles of top traders or expert chartered market technicians (CMT), browsing the market charts manually, or by checking trading/investment broker software for premarket percentage gainers/percentage losers.
Why Are Price Gaps Significant In Financial Markets?
Price gaps hold significant importance in financial markets due to the valuable insights they offer to traders and analysts. These gaps, resulting from abrupt changes in market sentiment, signify supply and demand imbalances.
Breakaway gaps and continuation gaps act as confirmation signals for the initiation or continuation of price trends, aiding trend-following strategies. Furthermore, gaps often serve as key support or resistance levels, influencing future price movements and providing reference points for traders.
Different gap patterns, such as breakaway, exhaustion, or island reversal, contribute to the broader analysis of chart patterns, assisting traders in making informed trading decisions. Gaps are also associated with increased market volatility, making them indicators of potential shifts in market dynamics.
What Is a Gap Fill in Technical Analysis?
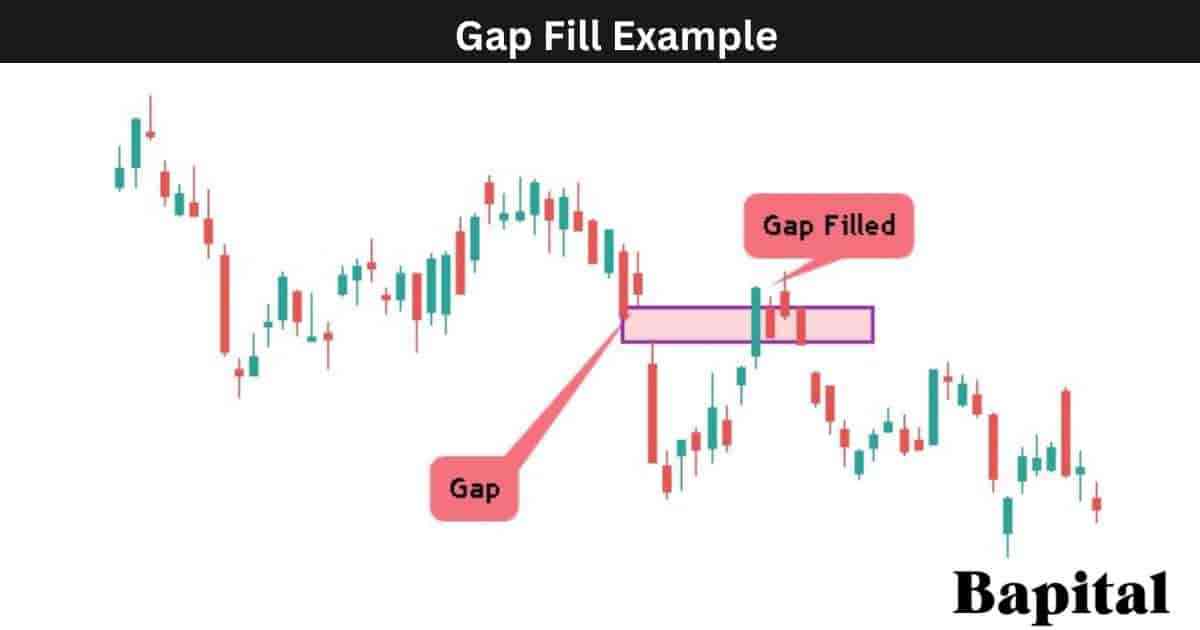
A gap fill refers to the price movement of a financial market whereby the price bounces or retraces to fill in the price gap created by a significant price change.
A gap fill on a gap up pattern is when the price retraces from the gap up opening price down to the previous closing price prior to the gap up.
A gap fill on a gap down pattern is when the price bounces and rises from the gap down opening price to the previous closing price prior to the gap down.
What Happens After a Gap Fill?
When a price gap is filled, it means that the price has returned to the level where the gap originally occurred, and there is no longer a gap in the price chart. After a gap fill, there is typically a price consolidation period or a temporary bounce away from the gap fill price before a new trend is established.
How To Trade a Gap Pattern
The gap pattern trading steps are listed below.
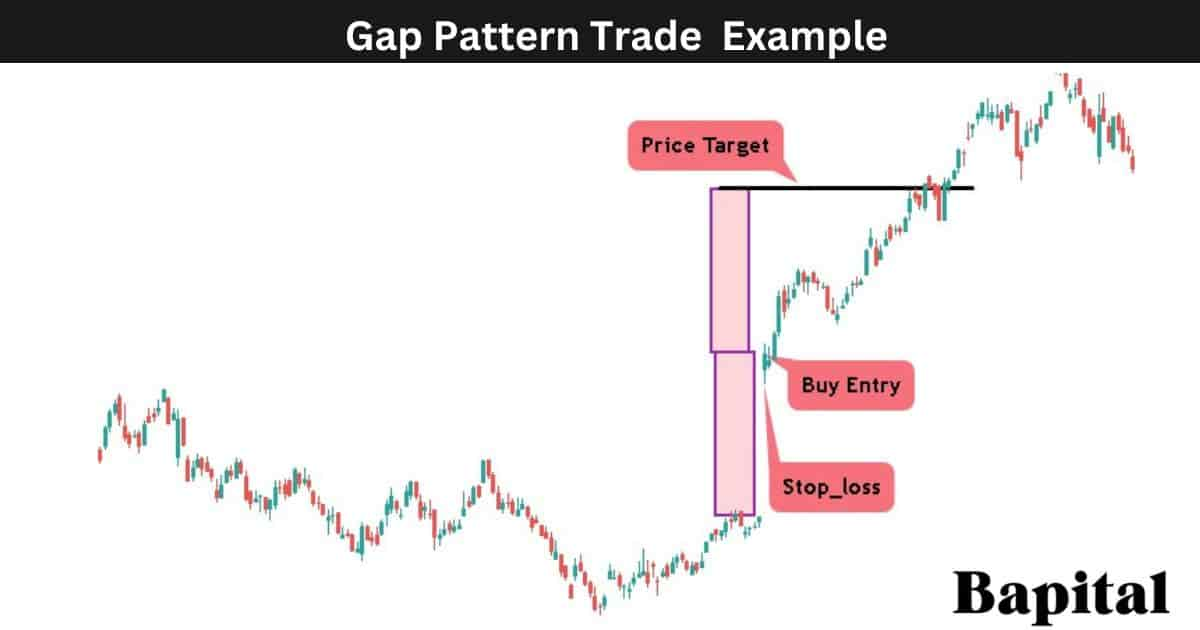
- Wait for a breakaway gap to form
- Enter a buy trade/short trade at the breakaway gap opening price
- Place a price target order the same distance as the gap
- Put a stop-loss order at the pre-market lows/highs
- Set the position size to equal 1% of trading capital risk
1. Wait For a Price Breakaway Gap
The gap pattern first trading step is to wait for a breakway gap to form. A breakaway gap forms after a price consolidation phase or after a chart pattern formation.
2. Enter a buy trade/short trade at the breakaway gap opening price
The gap pattern second trading step is to enter a buy trade/short trade at the breakaway gap opening price. The breakaway gap up entry price is set right as the market opens and the breakaway gap down sell entry price is set right at the market opening price.
What Is a Gap Pattern Entry Point?
A gap pattern trade entry point is the opening price of the gap.
3. Place A Price Target Order The Same Price Distance As The Gap
The gap pattern third trading step is to place a profit target order by measuring the distance of the gap and adding/subtracting this price difference from the gap opening price.
How Do You Calculate the Gap Pattern Price Target?
The gap pattern price target is calculated by taking the price distance between the closing price and opening price of the gap and adding/subtracting it from the gap opening price. For example, if a stock price closed at $20 and opened at $25, the gap price target would be $30 ($25+$5).
The gap up pattern price target calculation formula is Gap Up Pattern Price Target= Price Gap Distance + Gap Up Opening Price.
The gap down pattern price target calculation formula is Gap Down Pattern Price Target= Gap Down Opening Price - Gap Down Price Distance.
4. Put A Stop-Loss Order At The Pre-Market Lows/Highs
The gap pattern fourth trading step is to put a stop-loss order at the pre-market lows/highs of the gap. When a trade is entered at market open, pre market highs/lows will be established and a trader can easily place their stop-loss orders at the high or low of the pre-market session.
How Do Traders Manage Risk When Trading Gaps?
Traders manage risk when trading gap patterns by waiting for the pre-market session to form and setting a stop-loss order at the pre-market low price of a gap up or setting a stop-loss order at the pre-market high price of a gap down.
What Is The Risk/Reward Ratio When Trading Gap Patterns?
A gap pattern risk/reward ratio is 3:1 meaning a reward of $3+ for every $1 risked.
5. Set The Position Size To Equal 1% Of Trading Capital Risk
The gap pattern fifth trading step is to set the trade position size to equal a risk amount of 1% of trading capital. The position size is the number of contracts/shares to trade on a given trade position. For example, if the gap opening price is $100 and the stop-loss price is $99 and my risk is $200, the position size is 200 shares in this example.
What Is a Gap Pattern Trading Strategy?
A gap pattern trading strategy is the breakaway gap bull flag strategy which involves searching for bull flag patterns and waiting for price gapping up out of a bull flag pattern and trending higher.
Enter a long trade position at the price gap up level with a stop-loss order placed below the 10 exponential moving average. Set a price target by trailing a stop-loss order along the 10EMA and closing the trade position when the market price closes below the 10EMA. Risk 1% of trading capital when measuring trade position size. Do not use this strategy in illiquid markets.
What Are the Gap Pattern Trading Rules?
The gap pattern trading rules are below.
- Risk 1% of trading capital total
- Avoid trading during important market news events
- Avoid trading illiquid markets
- Create a trading plan with entries, exit prices, and stop-loss prices prior to trade entry
- Do not chase price during gap ups/gap downs
What Are The Common Mistakes When Trading the Gap Pattern?
The gap pattern trading mistakes are chasing price entries, ignoring market news, not assessing market liquidity and volume, not understanding risk management levels, and not understanding the cause of a particular price gap.
What Type of Gap Pattern Should Not Be Traded?
The common gap should not be traded as there is no real trading edge, no cause for this specific gap to occur, no high probability trading setup, and very little volume to confirm the price fluctuation.
What Are the Benefits Of a Gap Pattern?
The gap pattern benefits are below.
- Helps traders capture large trends: A price gap pattern assists traders in capturing the beginning of new large bullish and bearish trends from a low risk entry point
- Easy to identify: A price gap pattern is easy for novice traders to identify
- Improves market insights: A price gap pattern offers clues, insights, and understanding to the price action conditions and market sentiment of a specific capital market
- Helps identify market news events: A price gap is easy to scan for and when there is a gap up or gap dowm, a trader can quickly understand the cause of the gap by searching the news on the market
- Helps assess volatility: A gap highlights periods of increased volatility which allows for better risk management procedures
What Are the Limitations Of a Gap Pattern?
The gap pattern limitations are listed below.
- False signals: Some gap patterns generate false signals and not lead to big market moves which can cause trading losses for traders
- Incomplete information: Gaps may not always convey the full price action story in a market, and other factors must be considered for a complete analysis
- Subjectivity: Traders may interpret gap patterns differently, leading to varying conclusions and potential trading errors
- No causation: Some gaps like common gap patterns reveal price disparities but may not explain the underlying causes, requiring additional research
What Technical Indicators Are Used With Gap Patterns?
A gap pattern is used with technical indicators like the volume indicator, fibonacci extension, fibonacci retracement, moving average, R.S.I. oscillator, bollinger bands, keltner channels, and volume profile.
What Is The Most Popular Technical Indicator Used With Gap Patterns?
The gap pattern most popular indicator used is the volume indicator which helps measure the strength of a price gap up or price gap down.
What Is The Least Popular Technical Indicator Used With Gap Patterns?
The gap pattern least popular technical indicator is the Parabolic Sar indicator as this indicator generates manage false signals.
What Technical Indicator Is Used As A Confirmation Signal With a Gap Pattern?
A gap pattern confirmation technical indicator is the volume indicator as the volume indicator confirms whether there are large buyers or large sellers behind a big gap up or gap down in price.
What Does High or Low Volume On A Volume Indicator Indicate During a Gap?
High volume during a price gap up is considered bullish, signifying strong buying interest and confirming positive sentiment. This heightened activity suggests a substantial number of market participants actively supporting the upward movement, instilling confidence in the bullish trend. Additionally, high volume lends credibility to the price gap, indicating conviction among traders and investors.
Low volume during a gap can be interpreted with caution. While it may still indicate a gap-up, the lack of strong participation raises questions about the sustainability of the price movement and trend momentum.
What Is The Psychology Behind a Gap Pattern?
Gap pattern psychology reflects a shift in market sentiment and trader behavior.
A breakaway gap psychology indicates a surge in trader enthusiasm for a breakaway gap up or panic for a breakaway gap down, driving prices away from the previous closing levels with market participants interpreting the breakaway gap as a decisive move.
An exhaustion gap psychology reflects a last-ditch effort by one side to sustain the prevailing trend. As an exhaustion gap up occurs, traders panic in believing the trend will continue and begin selling and taking profits. As an exhaustion gap down occurs, traders start to get optimistic that a price bounce or price rally will occur as prices struggles to move lower.
An island gap pattern psychology, with its isolated price clusters, conveys a sense of detachment from surrounding market activity, representing a potential reversal in sentiment from positive to negative sentiment or negative to positive sentiment.
The psychology behind a continuation gap lies in a traders belief of sustained conviction in the prevailing trend. When a continuation gap occurs, it reflects a strong consensus among traders and investors that the current trend will continue. This gap signifies a continuation of the existing momentum rather than a reversal. Market participants remain confident in the prevailing direction continuing higher or lower.
What Are Gap Pattern Statistics?
Gap pattern statistics are illustrated in the statistics table below. All gap pattern statistical data has been calculated by backtesting historical data of financial markets.
Gap Chart Pattern Frequently Asked Questions
Below are frequently asked questions about the gap chart pattern.
Is A Gap Pattern Bullish Or Bearish?
A gap chart pattern can be either bullish or bearish depending on how the price moves after the gap. If the price gaps up and moves higher, this is a bullish signal. If the price gaps down and moves lower, this is a bearish signal.
Is A Gap Chart Pattern A Continuation Or Reversal Pattern?
A gap pattern can be either a reversal or a continuation pattern depending on how the price moves post the gap up/down. If the market price gaps up or gaps down and reverses, this is a reversal pattern and if the price gaps up or gaps down and continues in the same direction of the gap, this is a continuation pattern.
What Does a Gap Pattern Tell You?
A gap pattern indicates sudden changes in market prices between trading sessions, offering insights into market sentiment shifts, potential new price trend formations or significant events impacting asset values.
What Type Of Price Charts Do Gap Patterns Form On?
Gap patterns form on candlestick charts and bar charts. Gap patterns are not visible on line charts, point and figure charts, or area charts.
What Timeframes Can a Gap Pattern Form On?
Gap patterns form on all timeframes from short term 1-second timeframe price charts to longer term yearly price charts.
How Long Does a Gap Pattern Take To Form?
A gap pattern formation duration ranges from 1 minute to 1 day depending on the price chart timeframe used. On a one minute market chart timeframe, a gap up/gap down can form in one minute while on a daily timeframe price chart, a gap up/gap down can take one day to develop between price bars.
How Often Does a Gap Pattern Form?
A gap pattern forms an average of 34 times per year in U.S. Nasdaq stocks on daily price charts over the last 10 years. The number of gap formations vary significantly based on the timeframe price chart with shorter timeframe price charts under daily timeframe charts forming a higher number of gaps compared to longer timeframe price charts over weekly timeframe price charts forming a smaller number of price gaps.
What Type Of Traders Trade Gap Patterns?
A gap pattern is traded by scalpers, day traders, swing traders, position traders, long-term traders, technical analysts, and active investors.
What Are Books To Learn About Gap Patterns?
Price gap pattern books to learn from are "Technical Analysis of Financial Markets" by techncial analyst John Murphy, and "Getting Started in Chart Patterns" on page 53 by trader Thomas N. Bulkowski.
What Are Candlestick Gap Patterns?
Candlestick gap patterns are the upside tasuki gap and the downside tasuki gap.
What Are Gap Pattern Alternatives?
Gap pattern alternatives are listed below.
