What Is a Cup and Handle Pattern in Technical Analysis?
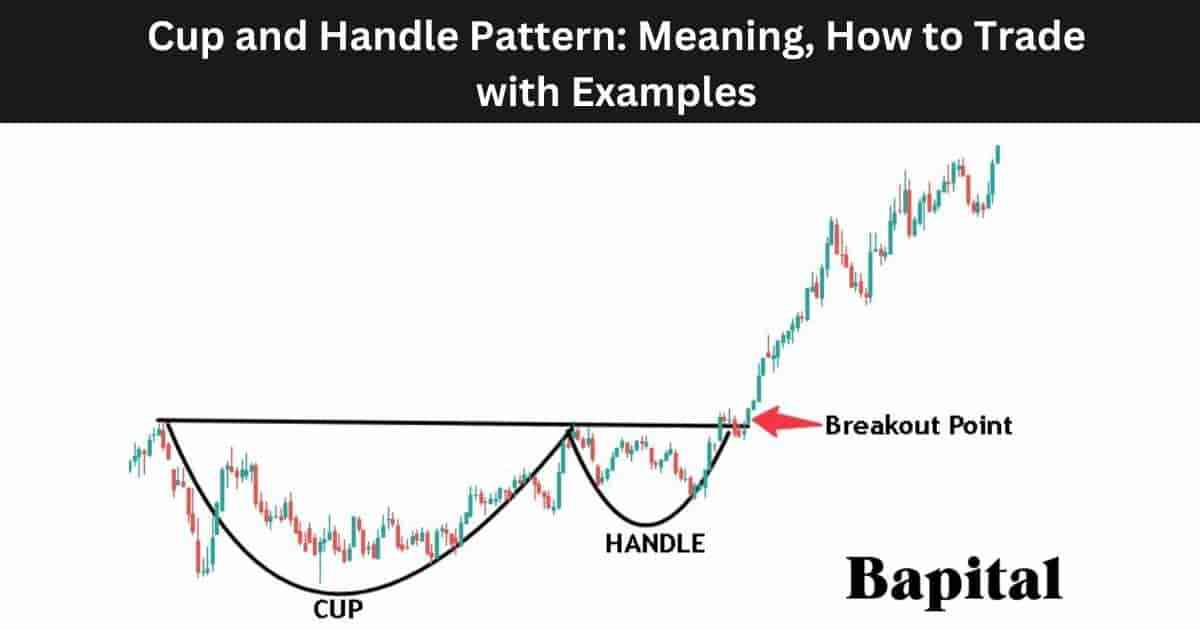
A cup and handle pattern is a bullish chart formation in technical analysis that signals a breakout above the pattern resistance level, followed by sustained upward price movement. A cup and handle pattern forms with a round U-shape bottom (cup) and a downward price pullback or sideways price consolidation period (handle) that precedes rising prices and increased buying volume. This volume surge confirms growing buy-side momentum and reinforces the breakout signal. The chart pattern indicates continued bullish price trends after asset prices rise above the resistance line. The pattern is confirmed by increasing trading volume which reinforces the bullish continuation signal. The cup and handle pattern appears on weekly and daily price charts and is observed across all financial markets including stocks, ETFs, indices, forex, and commodities.
The cup and handle pattern origins date back to the early 20th century. The pattern was made popular in the 1988 technical analysis book, How to Make Money in Stocks, by trader and Investor's Business Daily founder William J. O' Neil. The pattern is a tool for identifying trend-continuation breakout setups.
A cup and handle pattern's alternative name is the "teacup trading pattern". The cup and handle pattern's abbreviation is C&H.
What Are The Components Of a Cup and Handle Pattern?
The cup and handle pattern is composed of four components which are the cup, handle, resistance trendline, and price breakout. Each component is required for identifying a cup and handle pattern on a price chart.
1. Cup
The cup component is a rounded U-shape price formation that marks a price retracement and subsequent price rise. The cup indicates a period of market consolidation after a bullish trend, often resembling a bowl structure on the chart. During the cup component formation, selling pressure decreases and buyers start to increase their buying trade activity.
2. Handle
The handle component is a smaller U-shape whereby price drops between 10% to 50% of the original cup component height on lower decreasing volume before returning back to the price resistance high. This handle component indicates low selling pressure before a potential breakout.
3. Resistance Trendline
The resistance trendline component is a horizontal or descending sloped line that connects all the swing high prices at the top of the cup and handle pattern together. This resistance line component defines the pattern's upper boundary.
4. Price Breakout
The price breakout component is when market prices penetrate the pattern resistance area on rising bullish volume. This component confirms the pattern signal which triggers buying momentum and entry points for traders.
What Are The Types of Cup and Handle Patterns?
The 4 cup and handle pattern types are a classic cup and handle, cup and odd handle, an intraday cup and handle pattern, and a multi-year cup and handle pattern. Each type differs in structure, timeframe, and trading application across various markets including equities, cryptocurrencies, bonds, forex, and commodities.
1. Classic Cup and Handle
The classic cup and handle pattern features a rounded U-shape bottom and a handle that forms near the horizontal resistance trend line. This resistance line is drawn across swing high price points, and when price penetrates above, it signals a bullish continuation. Classic cup and handle pattern setups appear on daily or weekly charts and are used by swing traders and technical analysts.

2. Cup and Odd Handle
A cup and odd handle is a variation of the standard classic cup and handle whereby the handle component is more sloped and angular compared to the traditional handle shape. Despite the non-uniform appearance, the cup and odd handle is a bullish signal with a lower buy entry point compared to a traditonal cup with handle. This cup and odd handle pattern structure forms in more volatile markets and leads to early price breakouts. The cup and odd handle pattern is used by swing traders, position traders, and traders looking for lower risk entry points.

3. Intraday Cup and Handle Pattern
An intraday cup and handle pattern is a type of cup and handle pattern that forms within a daily trading session and is visible on sub-daily timeframes only. An intraday cup and handle forms within the span of a single trading session on lower timeframes including 1-minute, 5-minute, or 15-minute charts. Intraday cup and handle patterns are traded by scalpers and day traders seeking short-term breakout trading opportunities.

4. Multi-Year Cup and Handle Pattern
A multi-year cup and handle pattern is a type of cup and handle that forms over 1 to 7+ years. This multi-year cup and handle forms on weekly or monthly timeframe charts. This type of pattern signifies a prolonged accumulation phase and a breakout in price that leads to multiple years of bullish price movement. A multi-year cup and handle pattern is traded by long term traders, position traders, investors, and institutional market participants to identify major bullish continuation setups.

What Is The Formation Process Of a Cup and Handle Pattern?
The cup and handle pattern formation process begins with the cup component forming on the left side of the pattern after a consolidation period in the price action. The market asset price rises before a price pause and retracement and then price coils and trends higher to reach the prior price pause point. The cup depth varies and is not always a perfect semicircle.
Secondly, the handle component forms after the cup component on the right side of the pattern and is shaped like a smaller "u" with lower trading volume during this handle formation trading period. The handle is marked by a small price pullback of up to 50% of the cup component.
Thirdly, the cup and handle pattern resistance level component formation connects the swing high prices of the chart pattern together. The pattern's resistance point is either a horizontal resistance line, an upward sloping resistance line, or a downward sloping resistance line.
Fourthly, the pattern price breakout formation involves the price rising through the resistance area and continuing to increase higher.
What Happens After a Cup and Handle Pattern Forms?
After a cup and handle forms, the market price rises above the resistance area where a price breakout occurs and the asset price continues increasing higher in a bullish direction forming higher swing lows and higher swing highs as it rises.
What Causes a Cup and Handle Pattern To Form?
The causes behind the cup formation involves buyers initially dominating the market, leading to price increases. As the market price begins to show signs of weakening and leveling off, a period of consolidation ensues, forming the left side of the cup. This consolidation indicates a shift from sellers to buyers, with the rounding bottom resembling the shape of a tea cup or U.
The causes behind the pattern's handle formation involves traders taking profits after the initial cup formation or a natural market reaction to the preceding bullish movement.
The causes behind the breakout involves a shift in market sentiment, with buyers regaining control and driving prices above the resistance level established by the top of the cup area.
How Long Does a Cup and Handle Take To Form?
Cup and handle pattern formation timeframe ranges from a minimum of 80 minutes on a 1-minute price chart to 80+ years on a yearly price chart. To calculate the cup and handle pattern formation duration, multiple the chart timeframe used by 80. For example, a cup and handle pattern on a 15-minute price chart takes a minimum of 1,200 minutes (15 minutes x 80) to form.
How Often Do Cup and Handles Form?
Cup and handle patterns occur 1 to 2 times per year on a daily price chart depending on market environment. A shorter timeframe chart sees cup and handles form more frequently.
What Type Of Price Charts Do Cup and Handles Form On?
Cup and handle patterns form on candlestick charts, line charts, point and figure charts, area charts, open high low close (OHLC) charts, and bar charts.
What Markets Do Cup and Handle Patterns Form In?
A cup and handle pattern forms in all global markets including stocks, bonds, forex, cryptocurrencies, ETFs, futures, options, indices, and commodities.
What Timeframe Price Charts Do Cup and Handle Patterns Form On?
Cup and handle patterns form on all timeframes from short term tick charts to longer timeframe yearly price charts.
What Is The Most Popular Timeframe To Trade Cup and Handle Patterns?
The most popular timeframe to trade a cup with handle pattern is the weekly price chart as this timeframe is the most reliable with a 54% win probability for the weekly timeframe.
What Is The Least Popular Timeframe To Trade Cup and Handle Patterns?
The least popular timeframe to trade a cup and handle pattern is the 1-second price chart as the pattern generates many false signals on this short trading timeframe.
How Do Traders Identify a Cup and Handle Pattern?
A cup and handle pattern is identified by its shape which starts with a U shape bottom which is the cup component of the pattern. This "U" shape bottom takes a period of time to form and it should not resemble a sharp "V" shape as a V shape indicates the cup comnponent formed too fast. The handle shape is like a smaller "u" and it takes less time to form than the cup component. The handle component should have a 50% maximum height of the cup component.
How Do Traders Find Cup and Handle Patterns?
Cup and Handle pattern formations are found in markets by scanning the financial markets with a cup and handle charting screener, checking the online profiles of top traders or expert chartered market technicians (CMT), browsing the market charts manually, or by checking trading/investment broker software.
How Do Traders Scan For Cup and Handle Patterns?
Cup and handle pattern scanning involves traders using the Finviz.com cup and handle scanner, using a custom script to scan finance charts, or by using TradingView chart pattern scanners.
How Do Traders Draw a Cup and Handle Pattern
Cup and handle pattern drawing involves firstly plotting the cup component of the pattern which involves drawing a smooth rounded U shape on the price chart from left to right that connects the swing low price points together. A minimum of three price points are needed to draw the cup component of the pattern which are a swing high point on the left-side of the cup, a swing low point in the middle of the cup, and another swing high point on the right-side of the cup.
Secondly, plot the handle component which involves drawing a smaller rounded U shape from left to right that connects the swing low prices together. A minimum of three swing price points are needed to draw the handle component which are a swing high price point on the left side of the handle, a swing low price point in the middle of the handle, and a swing high price point on the right of the handle.
Thirdly, plot the pattern's resistance level component which involves drawing a resistance trendline from left to right connecting the swing high price peaks together. A minimum of three swing high peaks are needed to draw the resistance line correctly.
How To Trade a Cup and Handle Pattern
The cup and handle pattern trading steps are below.
- Identify a cup and handle pattern in a financial market
- Enter a buy trade position when the price breaks above the pattern resistance trendline on increasing buying volume
- Set the pattern price target order
- Put a stop-loss order below the swing low price of the handle component of the pattern

1. Identify the Cup and Handle On A Price Chart
The first cup and handle pattern trading step is to identify the pattern on a market chart by manually browsing finance charts or by using a pattern scanner.
2. Enter Buy Trade After Pattern Breakout
The second cup and handle trading step is to enter a buy trade after the price breaks out from the pattern on increasing buyer volume.
What is a Cup and Handle Pattern Entry Point?
A cup and handle pattern entry point is set when the price penetrates the trendlline resistance level of the pattern. This is the long entry point for the trade and is the cup and handle pattern breakout point. Watch for an increase in buying volume and bullish momentum as the price rises above this neckline resistance point.
3. Set the Cup and Handle Price Target Order
The third cup and handle trading step is to set the profit target order for the trade position by calculating the cup height and adding this to the buy entry price.
What Is a Cup and Handle Pattern's Price Target?
A cup and handle pattern price target is set by measuring the distance between the swing bottom price and the swing top price of the cup component of the pattern (cup height) and adding this to the breakout point over the resistance level. For example, if the buy entry price is $30 and the height of the pattern high and low is $10, the target for cup and handle pattern would be $40 ($30+$10).
What Is the Cup & Handle Price Target Calculation Formula?
The cup and handle pattern price target calculation formula is C&H Price Target = Breakout Price + Cup Depth.
4. Put A Stop-Loss Order Below Handle Swing Low Price
The cup and handle pattern's fourth trading step is to put a stop-loss order at the handle's swing low point. Place a stop-limit order or a stop-market order at this level to manage risk. Be cautious for trade order slippage.
What Is The Risk Management of a Cup and Handle Pattern?
Cup and handle pattern risk management is set by placing a stop-loss order below the swing low candlestick price of the handle of the pattern. Cup & handle trading risk amount is set at 1% of trading capital and traders adjust their position sizes to reflect 1% of capital.
What Is The Importance Of Risk Management When Trading a Cup and Handle?
The cup and handle pattern risk management is very important as it helps traders protect their capital against large losses and drawdowns, protect against a cup and handle failing, false signals, fakeouts, and price downtrends after a breakout.
What Are The Risks Of Trading a Cup and Handle Pattern?
The cup and handle pattern trading risks are overnight price gap downs, illiquid markets, order slippage, and unexpected market news events causing increased trading losses.
What Is The Risk/Reward Ratio When Trading Cup and Handle Patterns?
The cup and handle pattern trading risk-reward ratio is 2.50 to 1 meaning a reward of $2.50+ for every $1 risked.
What Are Common Mistakes When Trading Cup and Handles?
The cup and handle pattern trading mistakes are ignoring overall market conditons when entering a trade, overlooking the volume indicator to see if the volume is increasing as price breaks out, entering and exiting trades prematurely which can effect the risk/reward ratio and win rate, setting the wrong stop-loss level, ignoring news and events that can move the market, and a lack of patience.
What Is a Cup and Handle Pattern Trading Strategy?
A cup and handle pattern trading strategy is the trailing 10EMA breakout strategy. Scan for cup and handles in markets with bullish price trends of 8%+. Enter a buy trade position when the price breaks out of the pattern on increased buying pressure (green volume bars). Set a trailing stop loss order along the 10 exponential moving average. Exit the long trade position when the candlestick price bar closes below the 10EMA. Set the initial position size to be 1% of total trading capital.
Do not apply this trading strategy before or during important market news announcements.
What Type Of Trading Strategies Can Cup and Handles Be Traded In?
Cup and handles can be applied to scalping strategies, day trading strategies, swing trading strategies, position trading strategies, and investing strategies.
What Are the Cup and Handle Pattern Trading Rules?
The cup and handle pattern trading rules are risk a maximum one percent of total trading capital per trade, place buy trades at the pattern resistance breakout point, use the trading volume indicator to measure price breakout strength, avoid trading cup and handles during volatile news announcements, and identify the cup and handle pattern price target and stop-loss level prior to cup and handle trade entry.
- Risk 1% of trading capital at most
- Enter long position at the buy breakout price only
- Use the volume indicator for breakout strength measurement
- Do not trade before any important news annoucements
- Calculate the profit target price and stop-loss price before placing a trade
What Type Of Traders Trade Cup and Handle Patterns?
The cup and handle pattern traders are scalpers, day traders, swing traders, position traders, professional chartered technical analysts, and active investors.
What Top Trader Trades Cup and Handles?
The top cup and handle pattern trader is American investing champion Mark Minervini who trades a variation of the pattern.
What are Cup and Handle Pattern Examples?
The cup handle pattern historical examples are on the financial charts below.
Cup and Handle Pattern Stock Market Example

A cup and handle pattern stock market example is illustrated on the Tesla (TSLA) stock chart above. The pattern forms after a period of consolidation and sideways price action. The Tesla stock price sees a bullish breakout and security price moves higher to reach the profit target.
This example is best for stock traders seeking to trade a cup and handle.
Cup and Handle Pattern Short Timeframe Example

A cup with handle pattern short timeframe example is visually illustrated on the 1-minute EUR/USD forex currency pair chart above. The pattern forms in a short term uptrend. The currency price moves up out of the trading range and gap ups leading to higher forex prices after the breakout in a bullish direction.
This example is best for short term traders seeking to trade cup and handles including scalpers and day traders.
Cup and Handle Pattern Long Timeframe Example

A cup & handle pattern long timeframe example is shown on the weekly Soybean futures chart above. The futures price coiled up within the pattern's price range before breaking out. The Soybeans price trends up over the next few months as Soybeans entered a bull run before reaching the pattern's exit level.
This example is best for medium term and longer term position traders seeking to trade a cup and handle.
What is a Cup and Handle Pattern Failure?

A cup and handle pattern failure, also known as a "failed cup and handle pattern", is when a cup and handle pattern forms, the price breaks out and moves slightly higher above the resistance level of the pattern but fails to continue increasing in price and instead reverses and trends lower. It is considered a failure when the price fails and reverses from above the breakout level to below the swing low level of the handle. This pattern failure is a bearish signal.
A cup and handle pattern failure occurs occasionally and a trader protects against a pattern failing by setting stop losses to manage risk.
What Causes a Cup and Handle Pattern To Fail?
The cup and handle failure causes are below.
- Lack Of Buying Volume: A failed cup an handle pattern can be caused by low buying volume on a price breakout from the pattern resistance level as there is no real conviction in the bullish trend continuing as traders are not buying in large volumes with the view that the market will move higher
- Illiquid Markets: A cup and handle pattern can fail if the market security where the pattern forms is illiquid and lacks any trading volume. Illiquid markets could result in one large seller causing the pattern to completely reverse from bullish to bearish and ultimately fail
- Economic & Political News: A cup & handle failure can be caused by economic or political annoucements creating high price volatility in a market leading to unexpected price movement in a bearish direction
What Are the Cup and Handle Pattern Benefits?
The cup and handle pattern benefits are it helps provide price action clarity, it offers high reward to risk, it is beginner friendly, it works in multiple markets and multiple timeframes, and it can be applied to various trading strategy types.
- Offers High Reward Ratio: A cup and handle chart pattern offers a high reward to risk ratio, typically a reward of $2.50+ for every $1 risk
- Helps Provide Price Action Clarity: A cup and handle pattern helps a new trader understand the choppy price action in the market
- Beginner Friendly: The cup and handle pattern is beginner friendly and easy for a novice trader to learn with 4 components of the cup, handle, resistance, and breakout area to understand
- Works In Multiple Markets: A cup and handle pattern works in all global markets including stocks, futures, commodities, derivatives, forex, indices, options, ETFs, cryptocurrencies, and bonds
- Works On Multiple Timeframes: A cup and handle pattern works in all timeframes from tick charts to monthly charts and yearly charts
- Works In Multiple Trading Strategies: A cup and handle pattern works in many different trading strategies from a short term day trading strategy to a longer term swing trading strategy
What Are the Cup and Handle Pattern Limitations?
The cup and handle pattern limitations are false signals and subjective intrepretation.
- False Breakouts: The cup and handle can create false breakout signals which can cause traders to stop out of their trades and lose money
- Subjective Interpretation: Cup with handle patterns are subjective which means traders may interpret the formation differently, leading to variations in recognition
What Technical Indicators Are Used With Cup and Handle Patterns?
Cup and handle patterns are used with technical trading indicators like the volume indicator, exponential moving average indicator, the average true range indicator, the average daily range indicator, the MACD, Bollinger Bands, the VWAP, the RSI oscillator, and the Fibonacci retracement indicator in technical analysis.
What Is The Most Popular Technical Indicator Used With a Cup and Handle Pattern?
The cup and handle pattern most popular indicator used is the volume indicator which helps measure the strength of a cup and handle pattern breakout.
What Is The Least Popular Technical Indicator Used With a Cup and Handle Pattern?
The cup and handle pattern least popular technical indicator is the Parabolic Sar indicator as this indicator generates manage false signals and creates confusion when trading it with a cup and handle pattern formation.
What Technical Indicator Is Used As A Confirmation Signal With a Cup and Handle Pattern?
A cup and handle pattern confirmation technical indicator is the volume indicator as the volume indicator confirms whether there are large buyers behind a price breakout upward move.
What Does High and Low Volume On a Volume Indicator Indicate During a Cup and Handle Pattern?
High volume during a cup and handle price breakout indicates that large buyers are entering the capital market in anticipation of a large upward bullish trending move. The higher volume suggests market participants believe the market will successfully continue to higher pices and that there is a strong conviction amongst traders and investors.
Low volume during a cup and handle price breakout indicates that there are no large buyers entering the market and that traders lack conviction that market prices will rise.
What Is The Psychology Behind the Cup and Handle Pattern?
The cup and handle pattern psychology is characterized by increasing bullish sentiment. During the cup formation, the rounded bottom indicates a shift as selling pressure subsides and buyers cautiously enter the market. This phase reflects a hesitancy among previous sellers to exit trade positions at lower prices, while new buyers see a buying opportunity. The subsequent handle, a consolidation phase, signals a brief pullback with lower volumes as traders engage in profit-taking.
Recognizing this pattern allows traders to anticipate potential upward momentum as the market undergoes a shift from bearish sentiment to bullish sentiment.
When Are Traders Optimistic During the Cup and Handle Pattern Formation?
Traders are optimistic during a cup with handle pattern formation when the price turns and rises out of the pattern in a bullish uptrend direction. Traders are hopeful of the price appreciation continuing during this period.
What Are The Statistics Of a Cup and Handle Pattern?
How Accurate Is a Cup and Handle Pattern?
The cup and handle pattern accuracy rate is 49% from our historical backtesting data of 3,125 of these chart pattern formations.
What Timeframe Has The Highest Cup and Handle Pattern Win Rate?
The cup and handle pattern's highest win rate is the weekly timeframe price chart with a 54% win rate.
What Timeframe Has The Lowest Cup and Handle Pattern Win Rate?
The cup and handle pattern's lowest win rate is the 1-second price chart with a 43% win rate.
Is a Cup and Handle Pattern Reliable?
Yes, cup and handles are reliable if the trading rules are strictly followed. The higher timeframe weekly timeframe cup and handles are the most reliable with higher win probabilities compared to the lower timeframes having lower win probabilities.
What Market Conditions Is a Cup and Handle Most Reliable?
A cup and handle pattern is most reliable in bullish trending market conditions with prices appreciating.
What Market Conditions Is a Cup and Handle The Least Reliable?
A cup and handle pattern is the least reliable in choppy sideways market conditions with no trend direction.
Is a Cup and Handle Pattern Profitable?
Yes, a cup and handle pattern is profitable as the average success rate is 49% and the average return to risk ratio is 2.5 to 1. This means for every 100 trades, a trader wins 49 trades making 2.5 units (122.5 units total) and loses 51 trades losing 1 unit (51 units total). Therefore, over 100 trades, a trader should hypothetically net 71.5 units (122.5 units - 51 units). Be aware that past performance is not indicative of future trade results.
How Can Traders Make a Cup and Handle Pattern More Profitable?
A trader can make a cup and handle more profitable by trading the pattern on higher timeframe market charts only and avoiding trading prior to or during volatile market news announcements.
What's The Difference Betwee a Cup and Handle and a Double Bottom Pattern?
A cup and handle pattern's difference with a double bottom is a cup and handle's second swing low point is a maximum of 50% of the cup component while a double bottom's swing lows are both at the exact same level.
What's The Difference Between a Cup and Handle and a Double Top Pattern?
A cup and handle pattern's difference with a double top pattern are its shape and what is indicates. A cup and handle is shaped like a teacup while a double top is shaped like the letter M on a chart and a cup and handle is a bullish indicator while a double top is a bearish indicator.
What Are Alternatives To Cup and Handle Patterns?
The cup and handle pattern alternatives are listed below.
- Pennant chart patterns
- Inverted head and shoulders chart pattern
- Falling wedge chart pattern
- Triple bottom chart pattern
- Bullish rectangle chart pattern
What Is The Most Popular Cup and Handle Pattern Alternative?
The most popular cup and handle pattern alternative is the bull flag pattern which is a bullish chart pattern shaped like a flag.
What Is The Opposite Of a Cup and Handle Pattern?
The bullish cup and handle pattern's opposite is the bearish reverse cup and handle pattern, also known as the "inverse cup and handle".
What Is a Reverse Cup and Handle Pattern?
A reverse cup and handle is a bearish pattern in technical analysis that signals the market price will fall lower after a pattern price breakdown. A reverse cup and handle pattern is shaped like an inverted cup and handle.
What Are The Variations Of the Cup and Handle Pattern?
The cup and handle pattern variations are the rounded bottom and the double bottom pattern.
- Rounded Bottom: The rounded bottom is a variation of the cup and handle and it forms when the cup formation is not followed by a handle formation. In such cases, the price may break out directly from the rim of the rounded bottom resistance point rather than a pause occuring to form the hande section. Essentially, a rounded bottom pattern is if the cup component formed without the corresponding handle component
- Double Bottom: The double bottom is a variation of the cup and handle pattern and it forms when there are two swing low bottoms of equal height. Essentially, a double bottom pattern is if the cup component formed and another cup component formed with the same swing low trough point as a support level
What Are Resources To Learn About Cup and Handle Patterns?
Cup and handle pattern resources to learn from include books, websites, and courses.
What Are Books To Learn Cup and Handle Patterns?
The cup and handle pattern books to learn from are How to Make Money in Stocks by William J. O' Neil and Encyclopedia of Chart Patterns by Thomas N. Bulkowski.
What Are Websites To Learn Cup and Handle Patterns?
The cup and handle pattern websites to learn from are Bapital.com and Stockcharts.com.
What Are Courses To Learn Cup and Handle Patterns?
The cup and handle pattern courses to learn from are "Cup and Handle Chart Pattern" module by elearnmarkets, and "Trading Stock Chart Patterns For Immediate, Explosive Gains" by professional trader Frank Bunn.
What Are The Key Facts Of a Cup and Handle Pattern?
The cup and handle pattern key facts are listed below.